In today’s dynamic and fast-paced technology landscape, monitoring and ensuring the health and performance of your systems and applications is of utmost importance. This is where Prometheus comes into the picture. With its robust features and flexibility, Prometheus has gained popularity as a leading solution for gathering metrics, visualizing data, and alerting on anomalies in cloud native technology.
This blog post is an excellent starting point for beginners who want to learn the basics of Prometheus. It covers essential concepts and provides a solid foundation of knowledge. However, if you’re looking to delve deeper into advanced topics like how Prometheus works, time series databases, cardinality explosions, or custom patches, I highly recommend reading the comprehensive Cloudflare blog site. It offers in-depth insights and detailed explanations on these subjects, making it an invaluable resource for expanding your understanding of Prometheus.
How is Prometheus working?
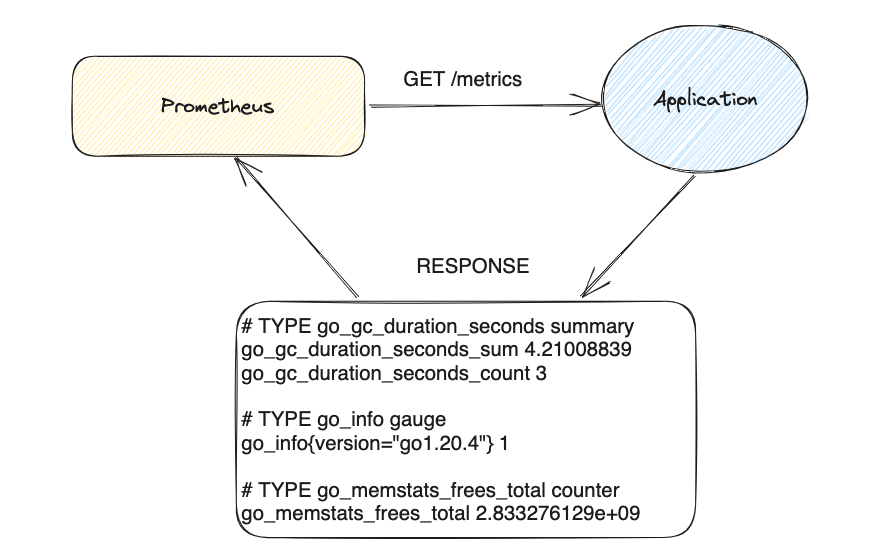
Prometheus operates on a pull-based mechanism, which sets it apart from traditional monitoring systems. In a pull-based model, Prometheus actively queries and collects metrics from the targets it monitors.

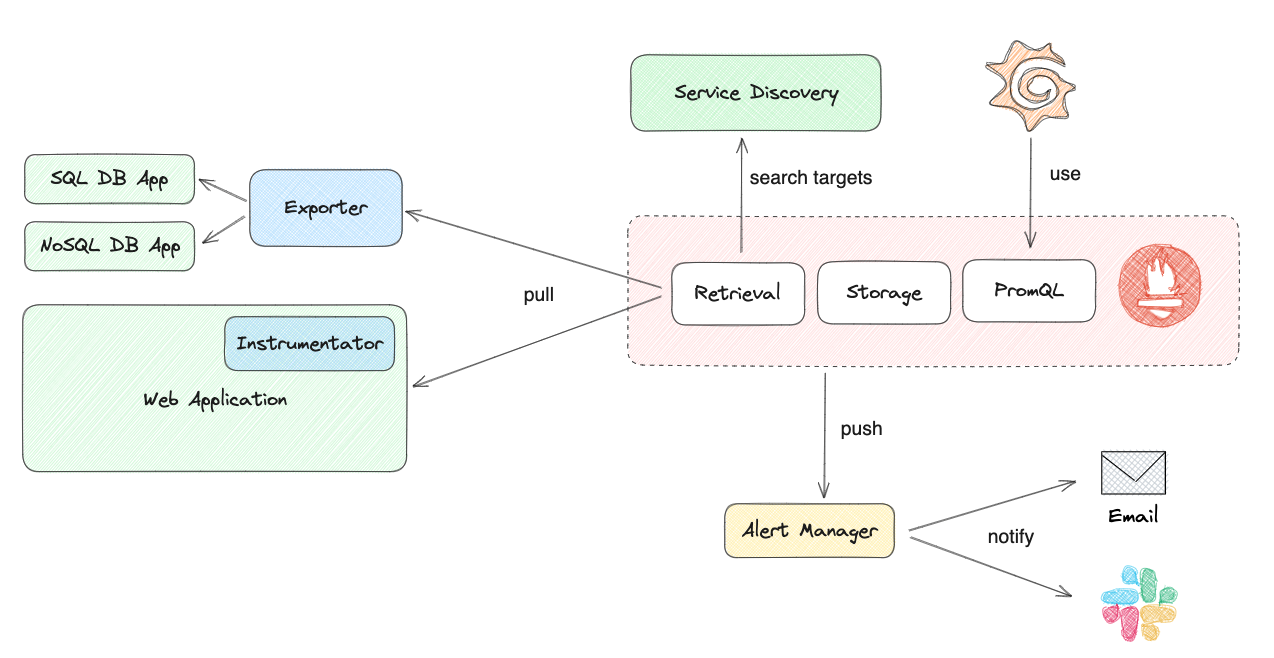
These 3 core components work together to provide a comprehensive monitoring and analytics solution. The retrieval component fetches metrics data from targets, the storage component stores and indexes the data, and PromQL enables users to query and analyze the collected metrics.
Installation

There are multiple installation options available for Prometheus, depending on whether you want to install it directly on your host or within your Kubernetes cluster. Let’s explore the four possibilities:
-
Single Binary: You can choose to install Prometheus by downloading a single binary file and running it on your host. This approach provides a straightforward and self-contained deployment of Prometheus.
-
Docker Container: Another option is to deploy Prometheus as a Docker container. With this method, you can leverage the containerization benefits, such as easy deployment, isolation, and portability.
-
Helm Chart: If you are using Kubernetes, you can take advantage of Helm, a package manager for Kubernetes applications. Prometheus offers a Helm chart that simplifies the deployment process and allows for easy configuration and customization.
-
Prometheus Operator: For more advanced Kubernetes setups, the Prometheus Operator offers additional functionalities and automation. It simplifies the deployment, management, and scaling of Prometheus instances within your Kubernetes cluster.
Metrics

The act of Prometheus sending HTTP requests to our application is referred to as “scraping.” Within the Prometheus configuration file, we specify a “scrape_config” that instructs Prometheus on the destination, frequency, and potential additional processing of the HTTP requests and responses.
Prometheus captures the timestamp when it sends each HTTP request and later utilizes it as the timestamp for all the collected time series data. Following each request, Prometheus parses the response to extract and gather all the exposed samples present within it.
Metrics Types
- Counter: is a increasing metric used to count occurrences or track total operations. (e.g. Number of requests)
- Gauge: is a metric with arbitrary up or down values, used for current measurements. (e.g. CPU usage percentage)
- Summary: tracks value distribution over time, including quantiles and sums. (e.g., Response time of an API endpoint)
- Histogram: aggregates values into predefined buckets for distribution analysis. (e.g. Request duration of an API endpoint, divided into buckets. 0-100ms, 100-200ms, 200-300ms)
Exporter & Instrumentator

Exporter is like a translator that collects metrics from a system or application and presents them in a format that Prometheus can understand. It acts as a bridge between the system being monitored and Prometheus, allowing metrics to be scraped and stored.
Instrumentation involves adding specific code or libraries to an application to gather metrics and insights about its performance and behavior.
For example, in a Python application with MongoDB, you can use a Prometheus exporter specifically designed for MongoDB and instrumentator for Python application. These exposes the metrics through an HTTP endpoint (/metrics).
Alert Manager

Alert Manager is a component of the Prometheus monitoring system that handles alerting and notification management. It receives alerts from Prometheus, evaluates them based on predefined rules, and takes actions such as sending notifications via various channels like email or chat platforms. Alert Manager provides deduplication and grouping capabilities to handle similar alerts efficiently. It also supports silence management to temporarily mute or suppress specific alerts. Overall, Alert Manager ensures timely and effective alert notifications, reducing noise and facilitating proactive response to critical events.
If you’re interested in enhancing your knowledge of Prometheus alerting capabilities, this informative blog post you can gain a deeper understanding of Prometheus alerting.
When NOT Prometheus?
- storing event logs or individual events -> use ELK stasck
- storing billing data -> not 100% accurate, Prometheus is not designed to ensure ACID
- storing PII data -> security risks and potential data breaches
- storing complex high cardinality data -> could be expensive
- dashboarding solution -> use Grafana
Hands-On Guide:
If you prefer a hands-on approach to learning, I have created a comprehensive guide that walks you through the installation and usage of Prometheus core components, such as Alert Manager, Exporter, and Instrumentator. This guide provides step-by-step instructions, enabling you to actively engage with these components and gain practical experience.