Hey there, I was recently presented with the chance to collaborate on crafting architectural diagrams using the C4 Model in my workplace and want to demonstrate how to create a software architecture diagram using the C4 model, and also guide you through implementing diagrams as code using the tool “Structurizr CLI”.
⚡ Tl;dr
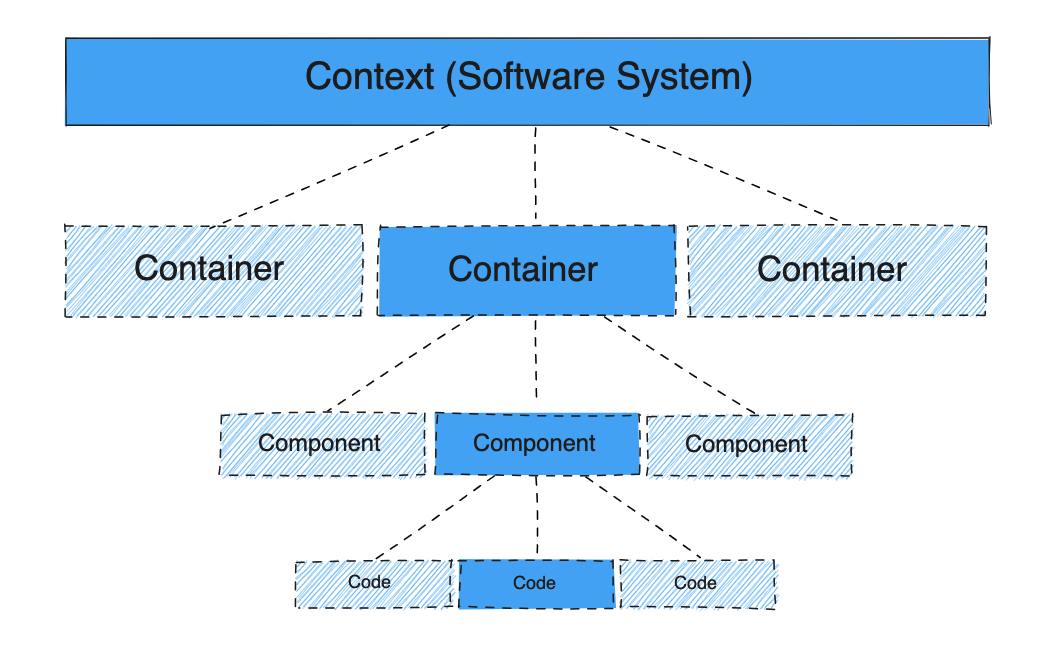
- The C4 model is a simple way to draw software architecture with 4 diagram types
- This model is a hierarchically visualizing of software architecture for technical and non-technical users
- C4 = Context, Container, Component, Code
- Simon Brown, a renowned software architect, speaker, and author, is the creative mind behind both the C4 model and the Structurizr CLI tool.
Clearing the Chaos of Software Architecture Representation
Software architecture diagrams are great for showing how you’re planning to create a software system (early design) or how a software system already works (looking back to document, share knowledge, and learn). However, it’s highly likely that most of the software architecture diagrams you’ve come across appear to be a chaotic arrangement of boxes and lines. And you can quickly lose the overall understanding of the software architecture.
Class / Code Diagram (UML or ER models) might not be easier to understand, and not all team members like product owners, data scientists, or external engineers need to know all the details. Therefore, the C4 model comes into play for all audiences aiming to showcase important software components catering to their diverse skills and varying interests.
🔎 Abstraction First, Notation Second!
Simon emphasizes, “We’re engineers, not artists. Having a shared set of abstractions matters more than having a shared notation.” I completely agree with his perspective. If your goal is to amaze your colleagues with complex symbols, charts, and technical language, you might unintentionally produce complicated diagrams that hinder communication due to their complexity. However, if your aim is for your colleagues to grasp the entire system architecture, it’s better to begin with a high-level perspective and gradually delve deeper, gradually uncovering the finer details.
🏗️ Mock Project “CNK”
To gain a better understanding, let’s explore these 4 models using my dummy project, Cloud Native Kiosk (CNK). Here, we have two main users: “customer” and “owner,” who purchase and manage kiosk products. If you’re interested in cloud-native development, CNK project could pique your interest.
🗺️ C4 Model Diagrams
We begin by establishing the simplest level of abstraction, Level1 Context Diagram for the system.
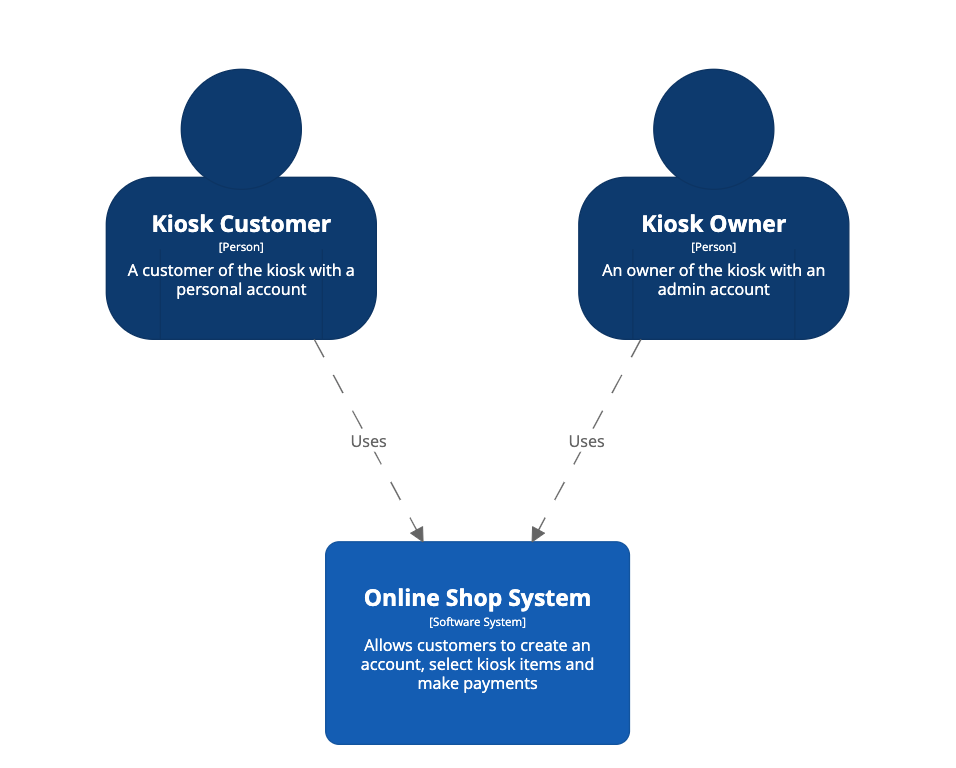
Level 1️⃣ Context Diagram
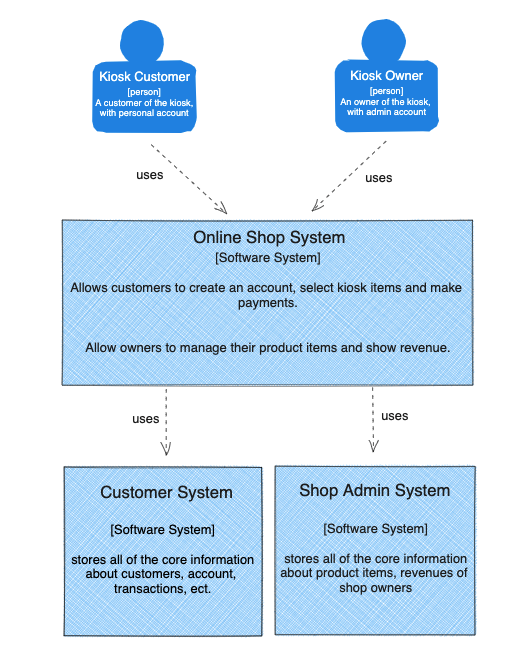
The online store is accessible to two user groups: “customer” and “owner.” The web interface interacts with two backend services, namely the “customer system” and the “shop admin system.” Level 1, which is a system context diagram, displays the software you’re creating and how it connects with the outside world, including the people who use it and the other software it works with.
Level 2️⃣ Container Diagram
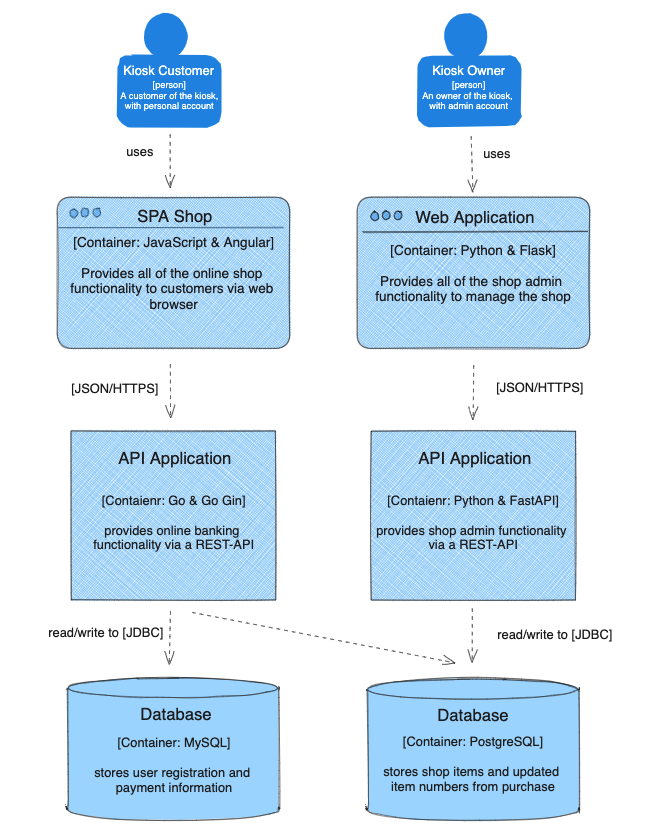
The customer can use the SPA service, built using JavaScript and Angular. This service connects to a Backend Application created with Golang and Gin. Customer data is stored in MySQL DB. On the other hand, the kiosk owner accesses a different application developed with Python and Flask, linked to the Flask Backend Service. Kiosk items are stored in a PostgreSQL DB. Level 2, a container diagram, provies a closer look at the software system, illustrates the software architecture’s overall structure, responsibilities distribution, major tech choices, and communication between containers. It’s a straightforward, technology-focused diagram valuable for both developers and support/operations teams.
Level 3️⃣ Component Diagram
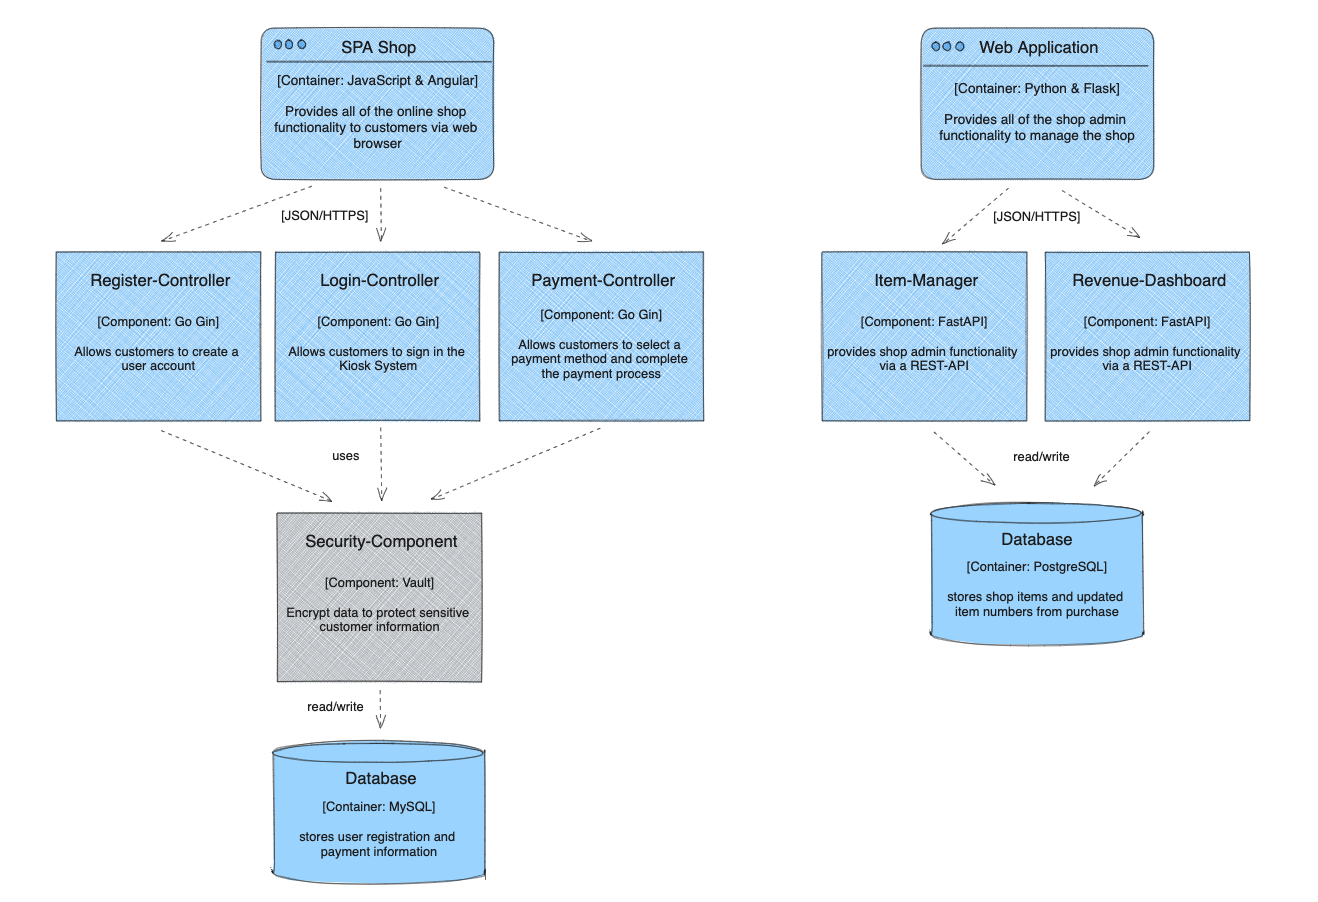
Now, the focus shifts from these two users to two services “SAP Shop” and “Web Application”. You can see the intricate logic of both containers as “components”, and there’s an extra component called “security-component” (HashiCorp Vault) visible as well. Level 3, known as a component diagram, goes deeper into an individual single container to display its internal parts. These parts should match actual sections in your codebase, like groups of code.
Level 4️⃣ Code Diagram
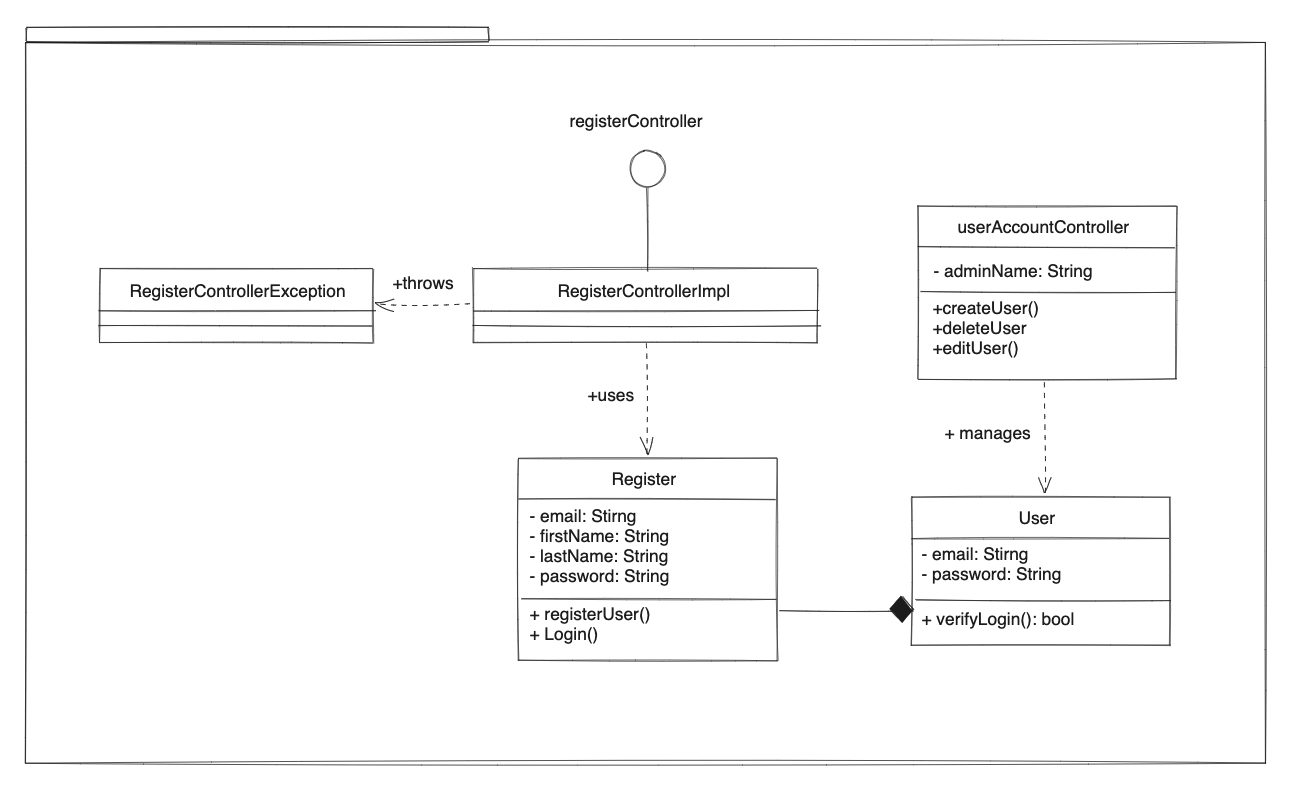
Finally, you will zoom in on a single part to see how it’s made. Level 4 diagram gives specific details about how each part is created. We can utilize class diagram with UML or Entity Relationship to show how the code looks.
🚀 C4 Model as Code
Generate software architecture diagrams with the help of diagram-as-code tool. Through the free version of ‘Structurizr Lite’, you can use it to view or modify diagrams, access documentation, and retrieve architecture decision records within a single DSL or JSON workspace file. In this chapter you can see how fast and simple it is to make diagrams using Structurizr Lite with Docker.
1. Create a new directory
mkdir new-project && cd new-project
2. Create and verify a diagram workspace
3. Create a file workspace.dsl
workspace {

    model {
        customer = person "Kiosk Customer" "A customer of the kiosk with a personal account"
        owner = person "Kiosk Owner" "An owner of the kiosk with an admin account"

        softwareSystem = softwareSystem "Online Shop System" "Allows customers to create an account, select kiosk items and make payments"

        customer -> softwareSystem "Uses"
        owner -> softwareSystem "Uses"

    }

    views {
        systemContext softwareSystem "Level-1" {
            include *
            autoLayout
        }

        theme default
    }

}
4. Docker run
ABSOULT_PATH=$(pwd)
docker pull structurizr/lite
docker run -it --rm -p 8080:8080 -v $ABSOULT_PATH:/usr/local/structurizr structurizr/lite
5. Open the workspace
If you have a stronger interest in the 4C model, you can explore Simon’s post on the Dev Community. Keep drawing and keep growing, fellow developers🚀