Welcome to Istio Hands-On Pt 2!
Building on the foundation of Part 1, we’re excited to take you further into the exciting world of Observability with Kiali, Prometheus and Jaeger! If you haven’t yet, make sure to check out the earlier session on setting up your Istio environment.
Below, you’ll find the table of contents detailing the Istio hands-on lab, organized into five informative sessions:
For this project, we are utilizing these github repositories:
Setup Istio Environment and Deploy Microservices
# Start the cluster and Setup Istio environment
bash ./istio-install.sh

# Deploy microservices
kubectl apply -f k8s/service-mesh/apps

# Check the deployment
kubectl port-forward svc/frontend-service 5000 &
What is Observability
Observability refers to the ability to understand, measure, and monitor the internal state and behavior of a system based on its external outputs. Through the utilization of three forms of telemetry “metrics”, “logs”, and “traces” offers comprehensive insights into distributed systems. This enables teams to identify the underlying causes of various issues and enhance the overall performance of the system.
I won’t delve into the details of metrics, traces, and logs at this moment. If you’re interested, you can find more information here.
Kiali
Kiali is primarily designed for observability in microservices architectures, focusing on service mesh monitoring. It provides visualization and insights into the behavior of microservices deployed in a service mesh. While Kiali itself doesn’t directly collect metrics, traces, or logs, it integrates with other tools that specialize in these areas.
Kiali often integrates with monitoring systems, like Prometheus, for metrics collection. It can also work with tracing systems, such as Jaeger or Zipkin, for distributed tracing. For logs, Kiali might be used in conjunction with logging solutions like Elasticsearch and Fluentd.
Create a Secret for Kiali Loggin
To enhance security, create a Kiali logging secret. Currently, Kiali uses built-in credentials (username: admin, password: admin), which are not recommended for production environments. (offical site)
Create Secret Variables
KIALI_USERNAME=$(read -p 'Kiali Username: ' uval && echo -n $uval | base64)
KIALI_PASSPHRASE=$(read -sp 'Kiali Passphrase: ' pval && echo -n $pval | base64)
NAMESPACE=istio-system
Configure secret variables
cat <<EOF | kubectl apply -f -
apiVersion: v1
kind: Secret
metadata:
  name: kiali
  namespace: $NAMESPACE
  labels:
    app: kiali
type: Opaque
data:
  username: $KIALI_USERNAME
  passphrase: $KIALI_PASSPHRASE
EOF
Install Kiali
To unlock the full power of Kiali’s dashboard and monitoring capabilities, you’ll need to have Prometheus installed. It fuels Kiali with the essential metrics it needs to display network traffic and service health.
Install Prometheus
ISTIO_HOME=$(ls | grep istio-1)
kubectl apply -f ${ISTIO_HOME}/samples/addons/prometheus.yaml
kubectl rollout status deployment/prometheus -n istio-system
kubectl get svc -n istio-system  | grep prometheus

# verify prometheus server
kubectl port-forward svc/prometheus -n istio-system 9090 &
open http://localhost:9090
Install Kiali
kubectl apply -f ${ISTIO_HOME}/samples/addons/kiali.yaml
kubectl rollout status deployment/kiali -n istio-system
kubectl get svc -n istio-system  | grep kiali
Start Kiali Dashboard
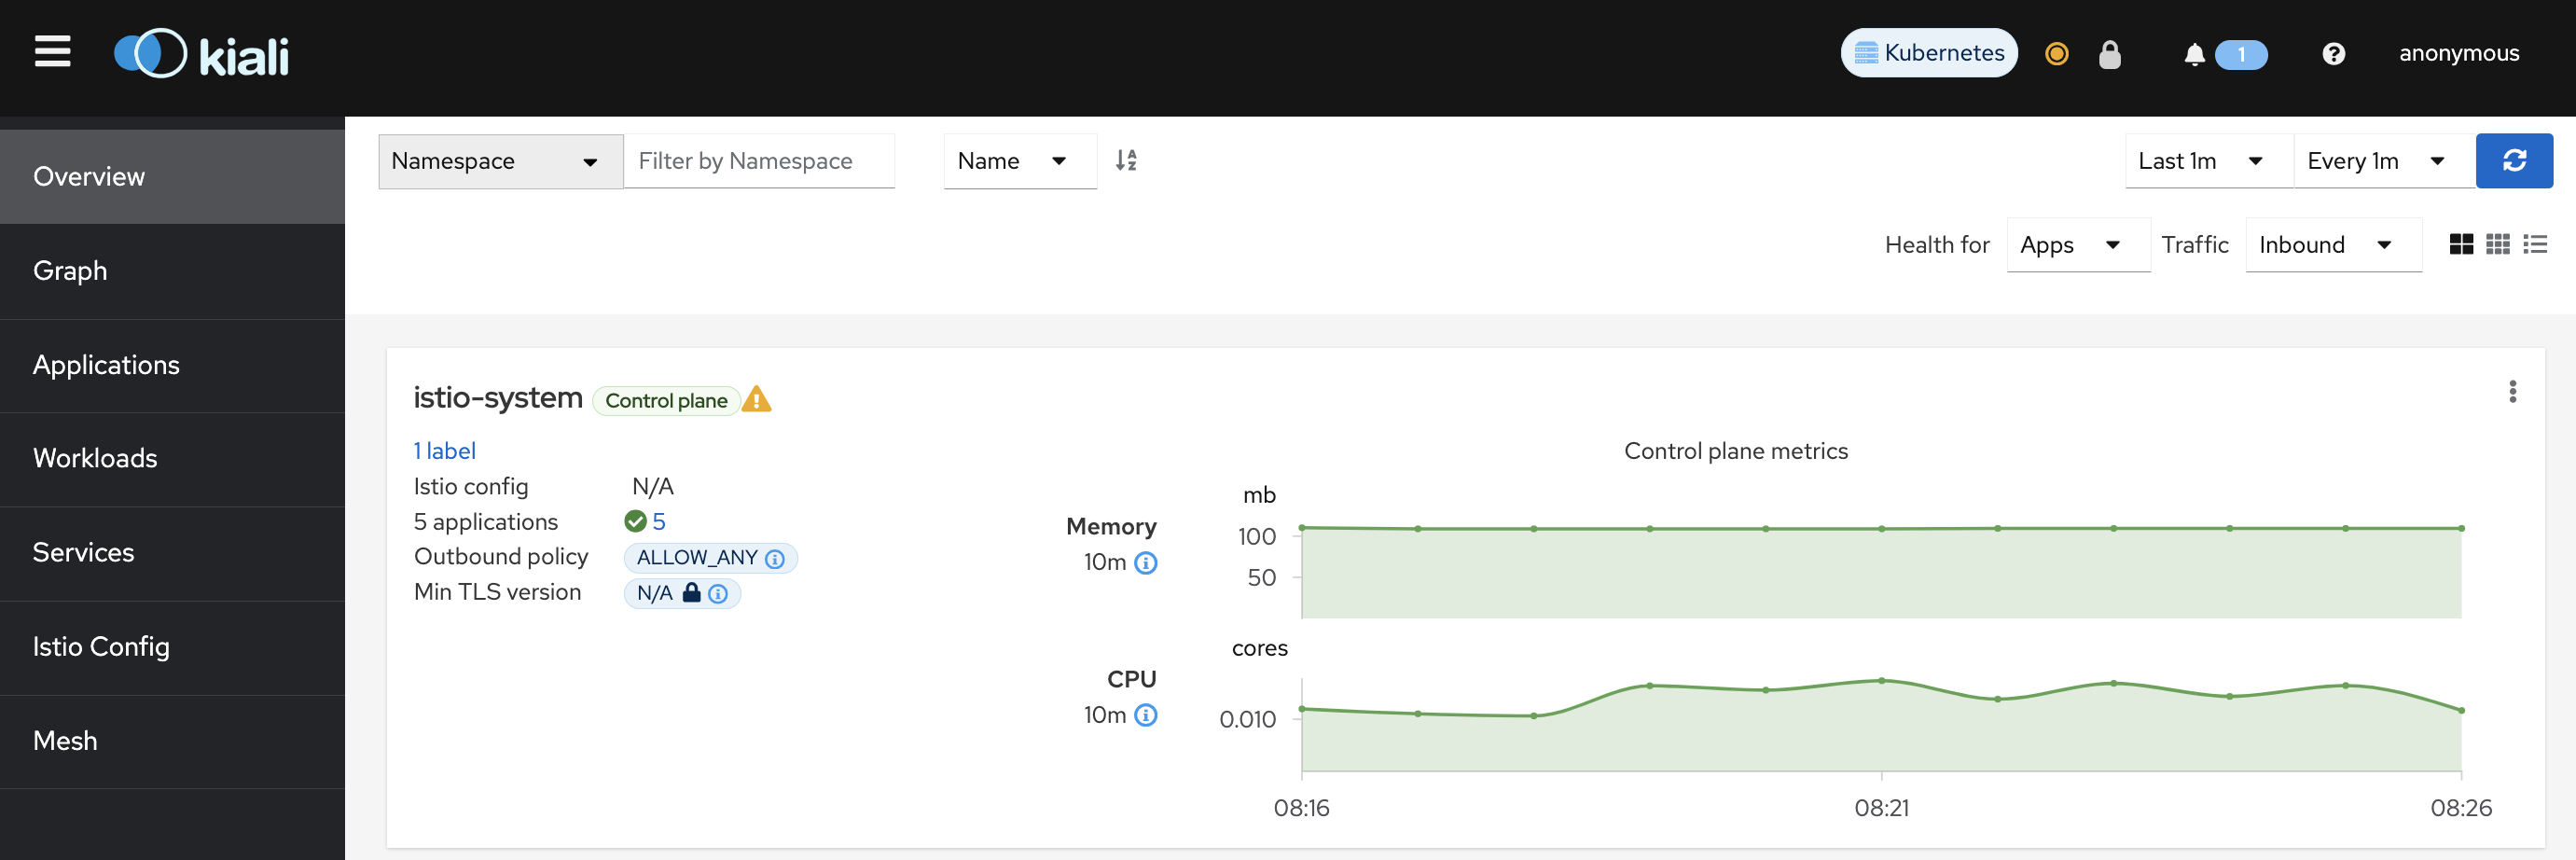
Launch Kiali with a Single Command and Access the Kiali Dashboard. You’ll be greeted by a login prompt. Remember to use your own credentials for production environments.
Open Kiali Dashboard
# option 1
kubectl port-forward svc/kiali 20001:20001 -n istio-system &

## option 2
istioctl dashboard kiali
Kiali Architecture
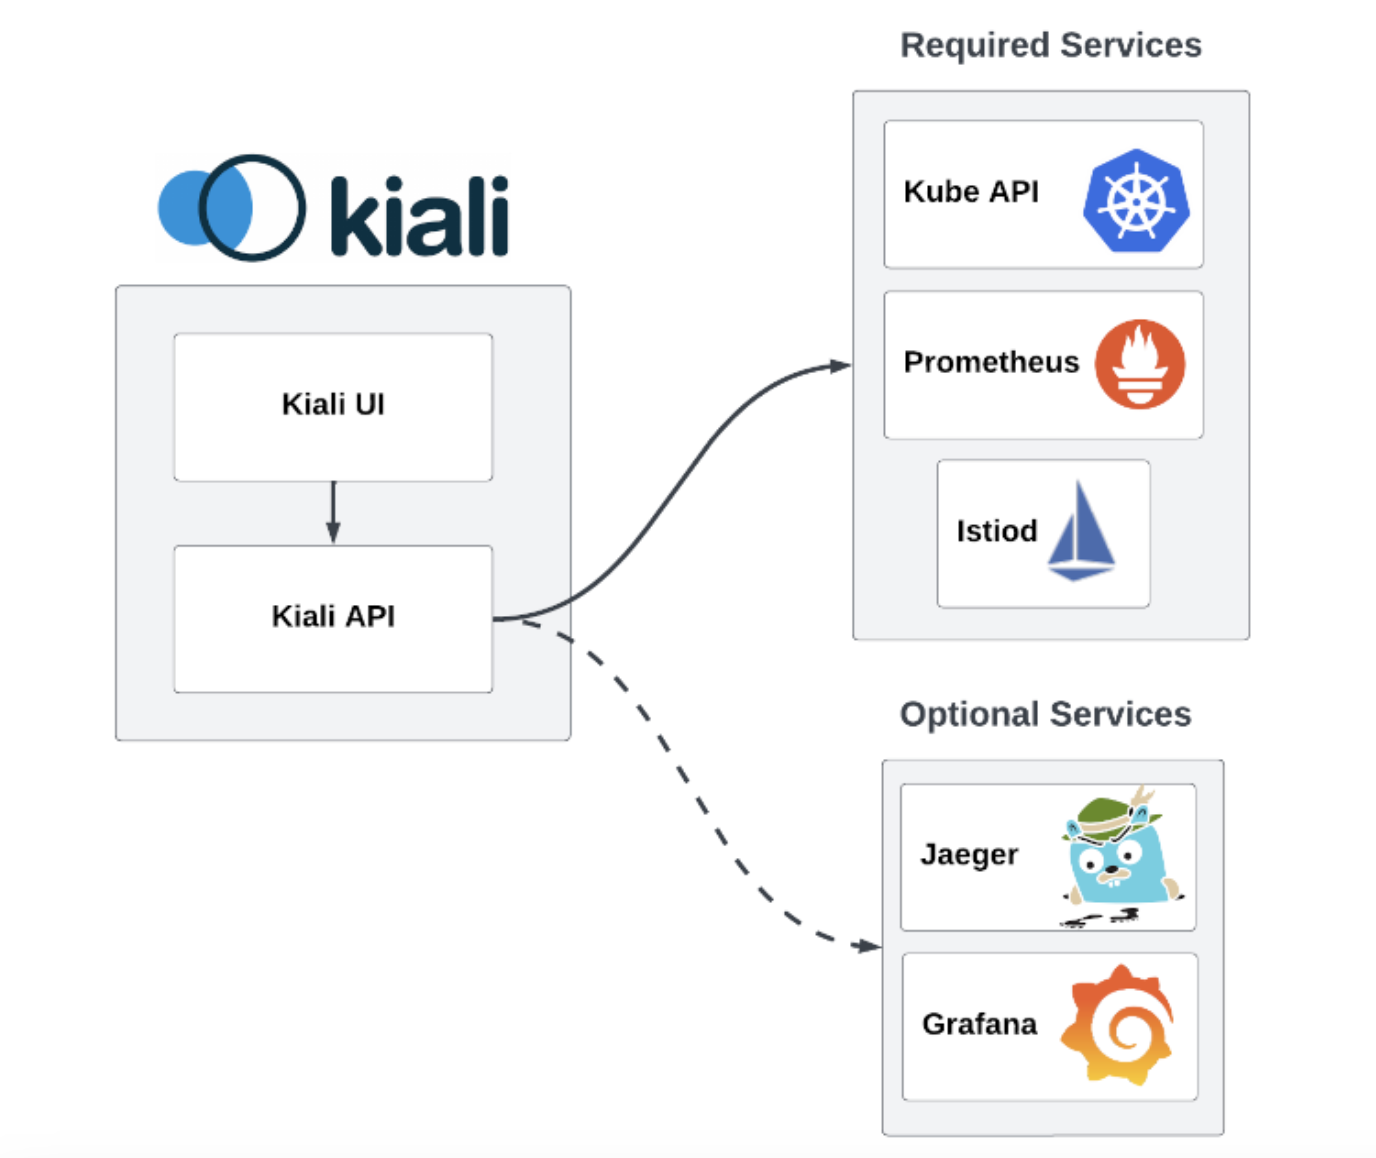
Envision Kiali as the command center overseeing your service mesh. Comprising two essential components, it boasts a backend written in Go and single-page application (SPA) frontend services constructed with Patternfly, React, Typescript, and Redux. Kiali relies on various external services, including Prometheus, Kube API, Istiod, and components furnished by the container application platform and Istio, seamlessly integrating them to provide a comprehensive and robust management solution for your service mesh.
Create Traffics
To truly appreciate Kiali’s power, create some dummy traffic! Call the frontend app that interacts with your backend services. As traffic flows, watch Kiali update in real-time, illustrating the connections and performance metrics.
SERVICE_NAME="frontend-service"
SERVICE_PORT="5000"

# verify
kubectl get svc -n default | grep $SERVICE_NAME

# port forwarding
kubectl port-forward svc/$SERVICE_NAME $SERVICE_PORT

# visit the frontend app
while sleep 5; do curl "http://localhost:$SERVICE_PORT"; done
Kiali Dashboard
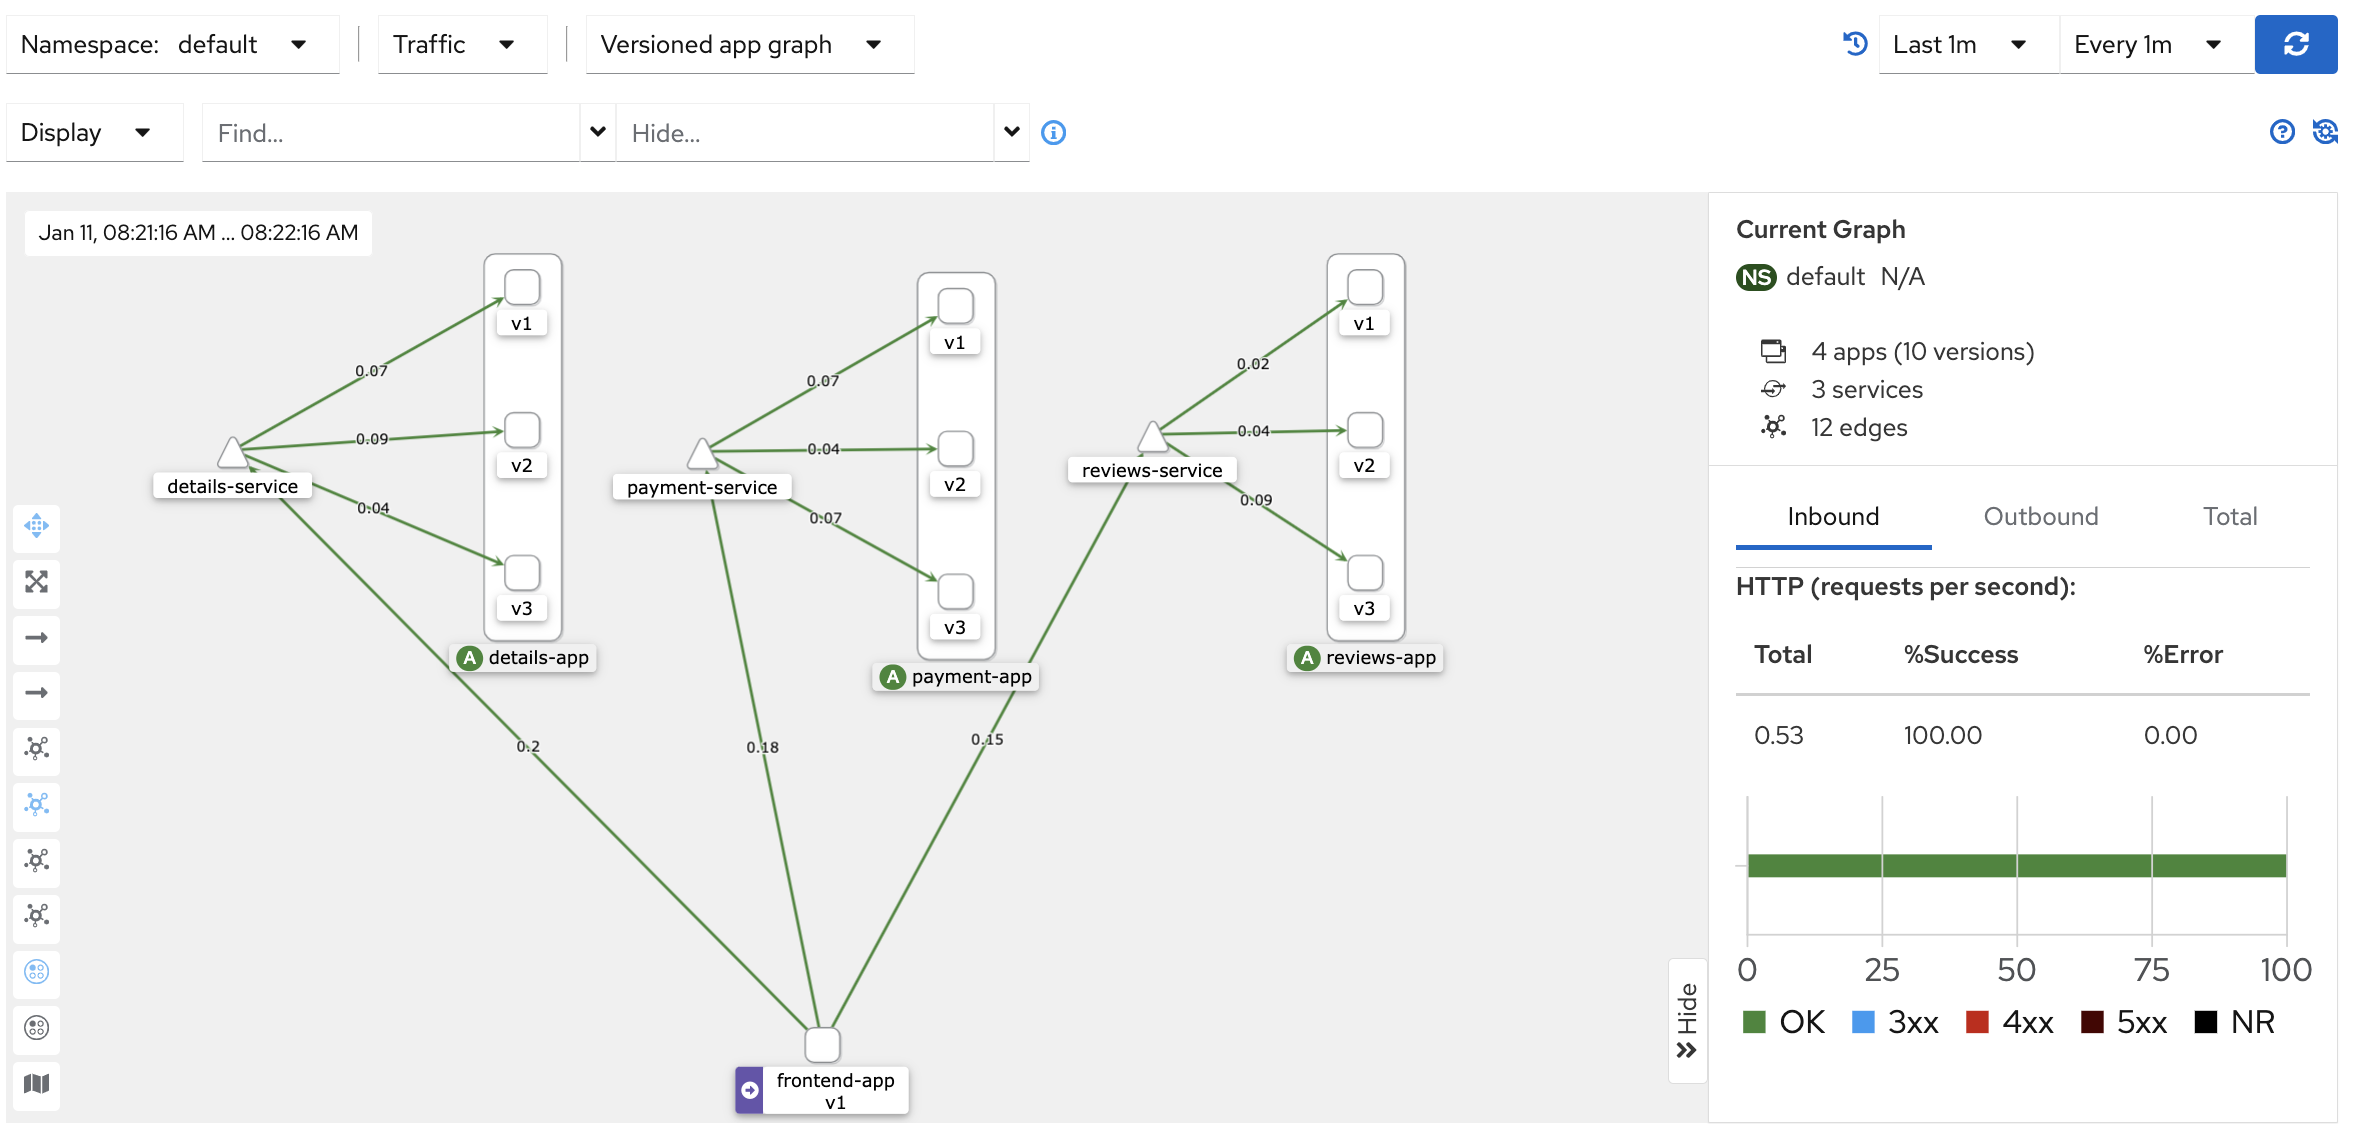
Kiali’s Graph shows a vibrant visualization of your mesh traffic, weaving real-time data with Istio configuration. See service talk, spot issues instantly, and zoom in with multiple views: services, workloads, or applications. It’s like a live network detective story, guiding you to performance insights and troubleshooting wins. Ditch the confusion, embrace the clarity – Kiali’s Graph empowers you to master your mesh.
Uncover the Issue
In order to simulate a real issue, we deliberately remove all deployments of the details service.
kubectl delete deployment details-v1
kubectl delete deployment details-v2
kubectl delete deployment details-v3
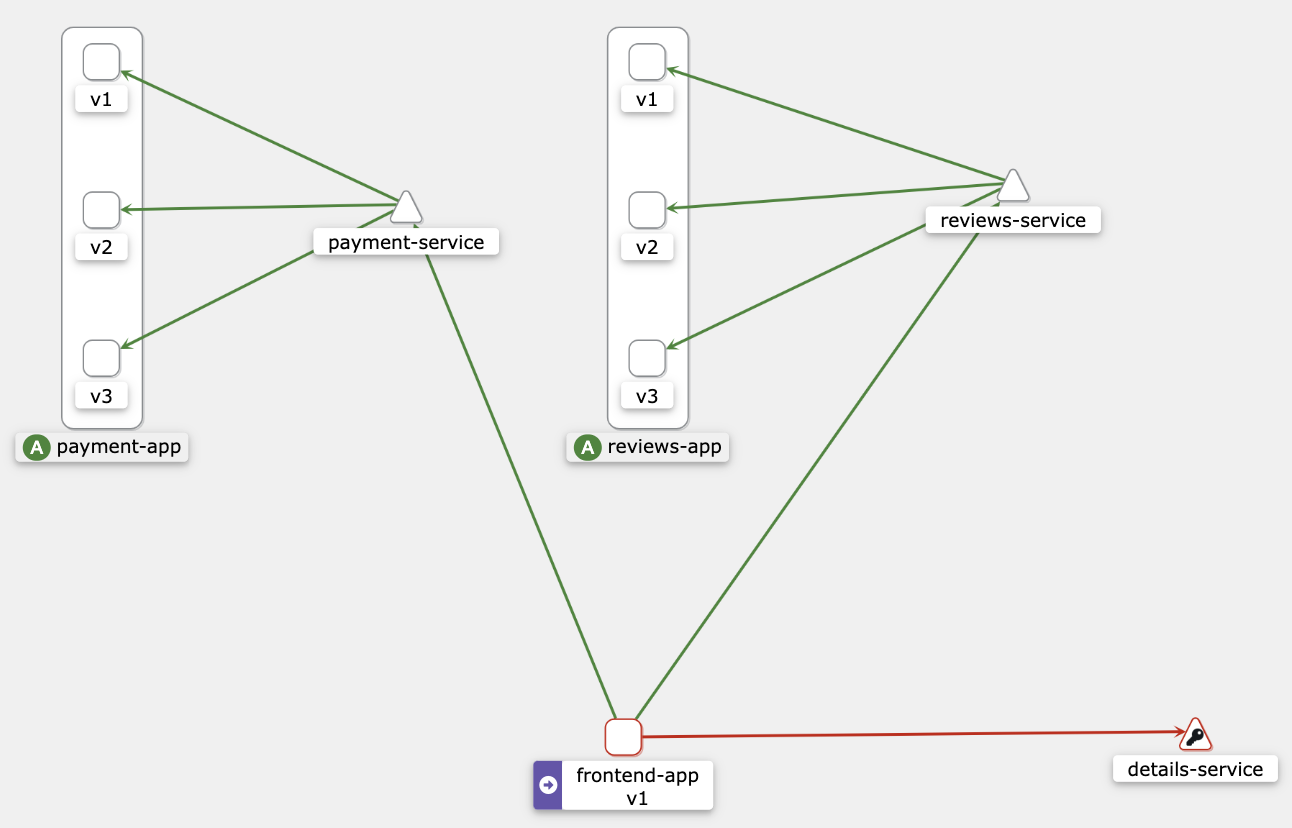 Now, observe the repercussions of this change in the graph. The details page is no longer accessible, and all requests are resulting in 500 errors.
Jaeger
Jaeger is an end-to-end distributed tracing system and helps developers and system administrators gain insights into the flow of requests and transactions across various services within a distributed system.
Install Jaeger
ISTIO_HOME=$(ls | grep istio-1)
kubectl apply -f ${ISTIO_HOME}/samples/addons/jaeger.yaml
kubectl rollout status deployment/jaeger -n istio-system
kubectl get svc -n istio-system  | grep jaeger
Create Dummy Traffics
kubectl port-forward svc/frontend-service 5000 &
while sleep 0.5; do curl "http://localhost:5000"; done
Run Jaeger
istioctl dashboard jaeger
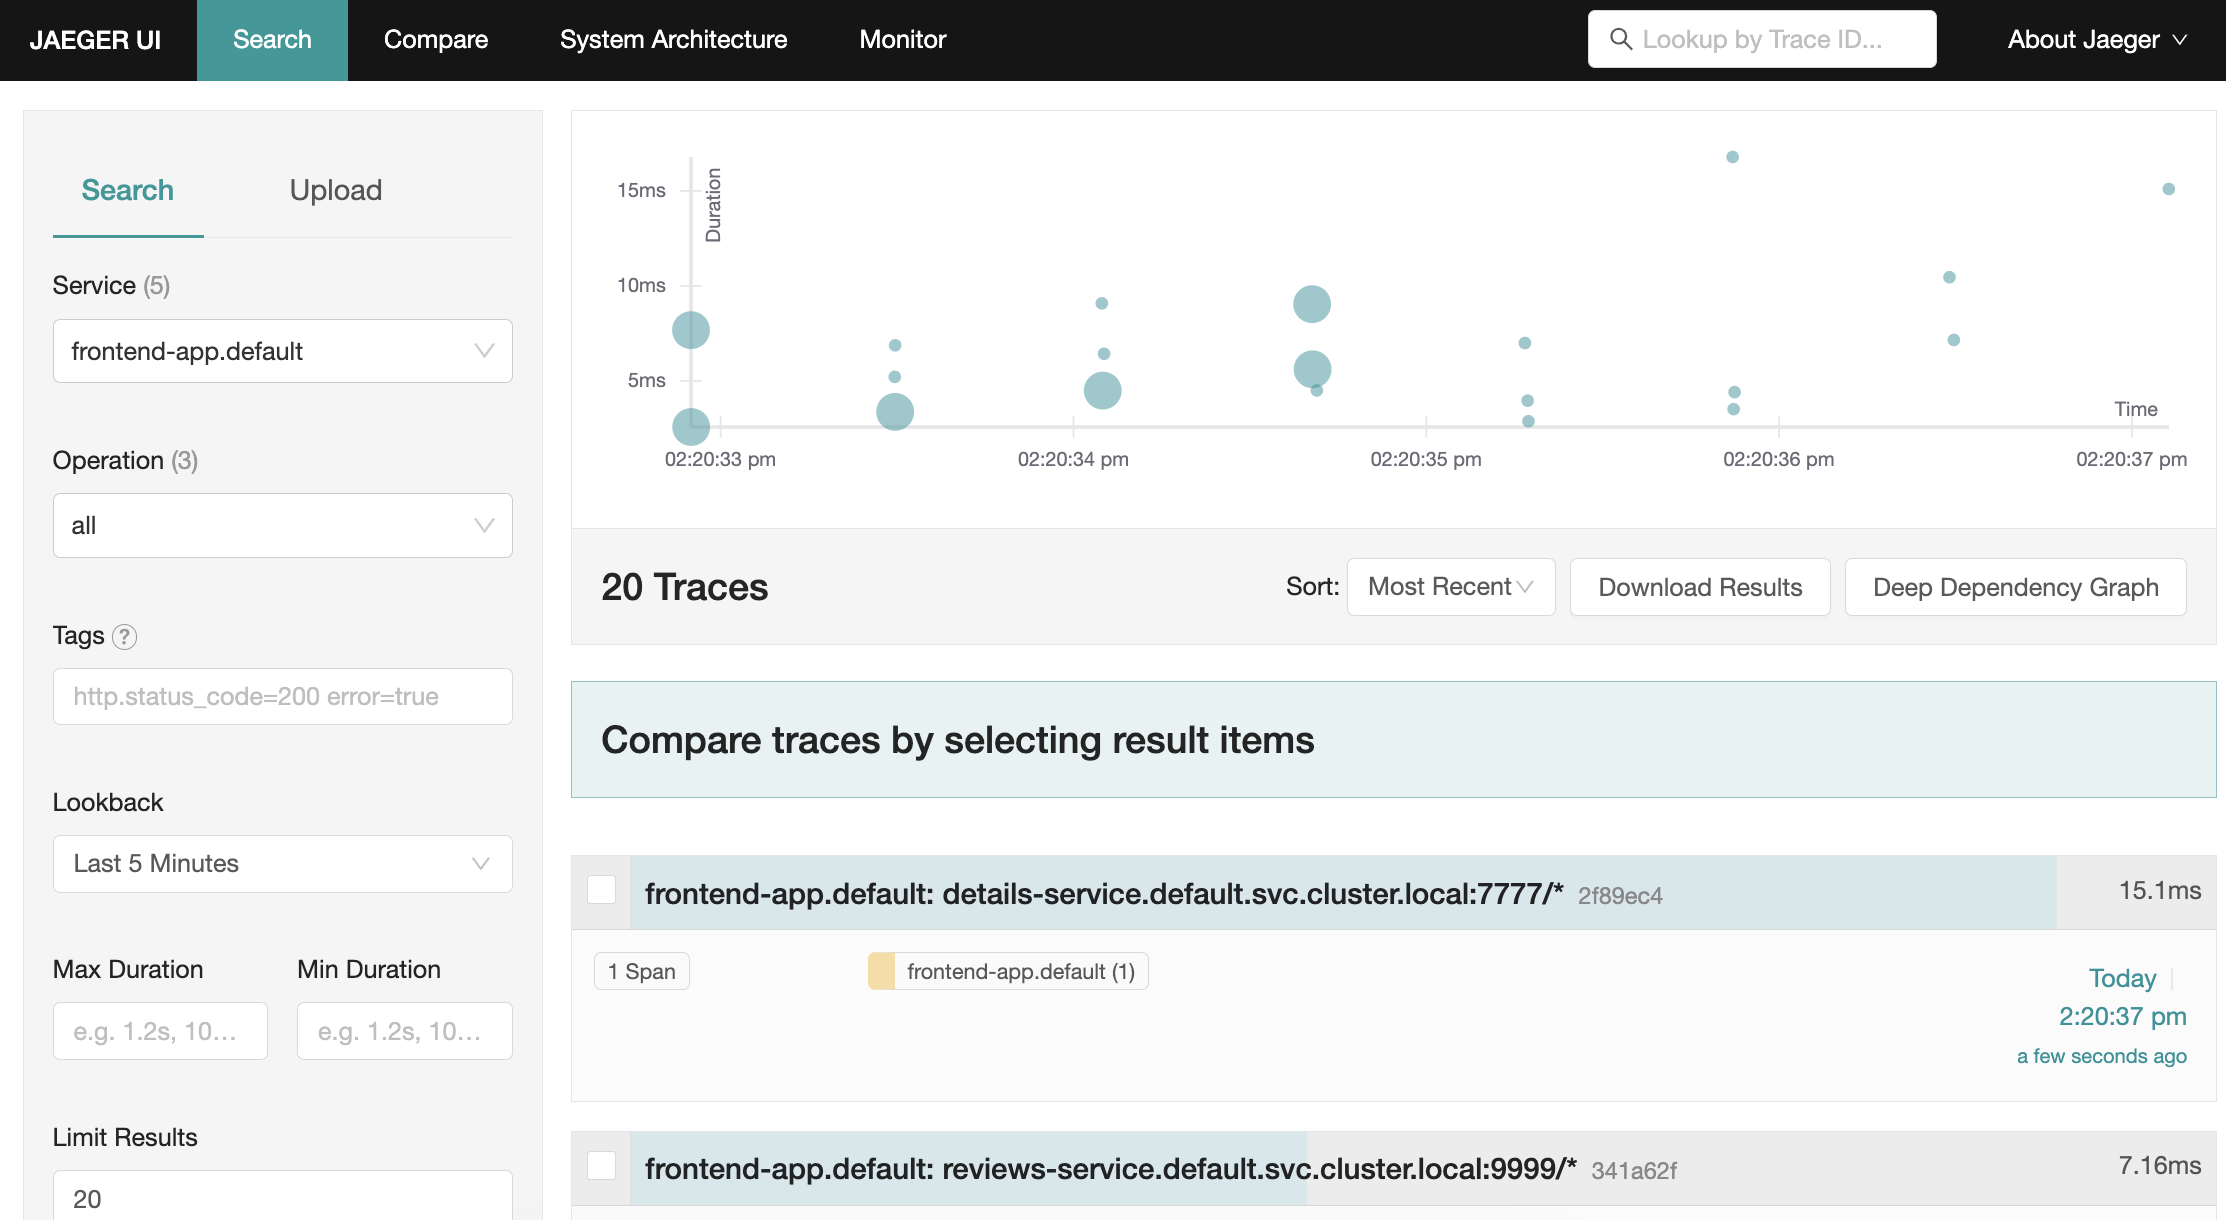
Now, the browser automatically opens, and we can see the Jaeger UI. We can delve deeper into a service and observe the duration time of all services, including the total time. Here, we can easily identify specific slow services or services that may be blocking others.
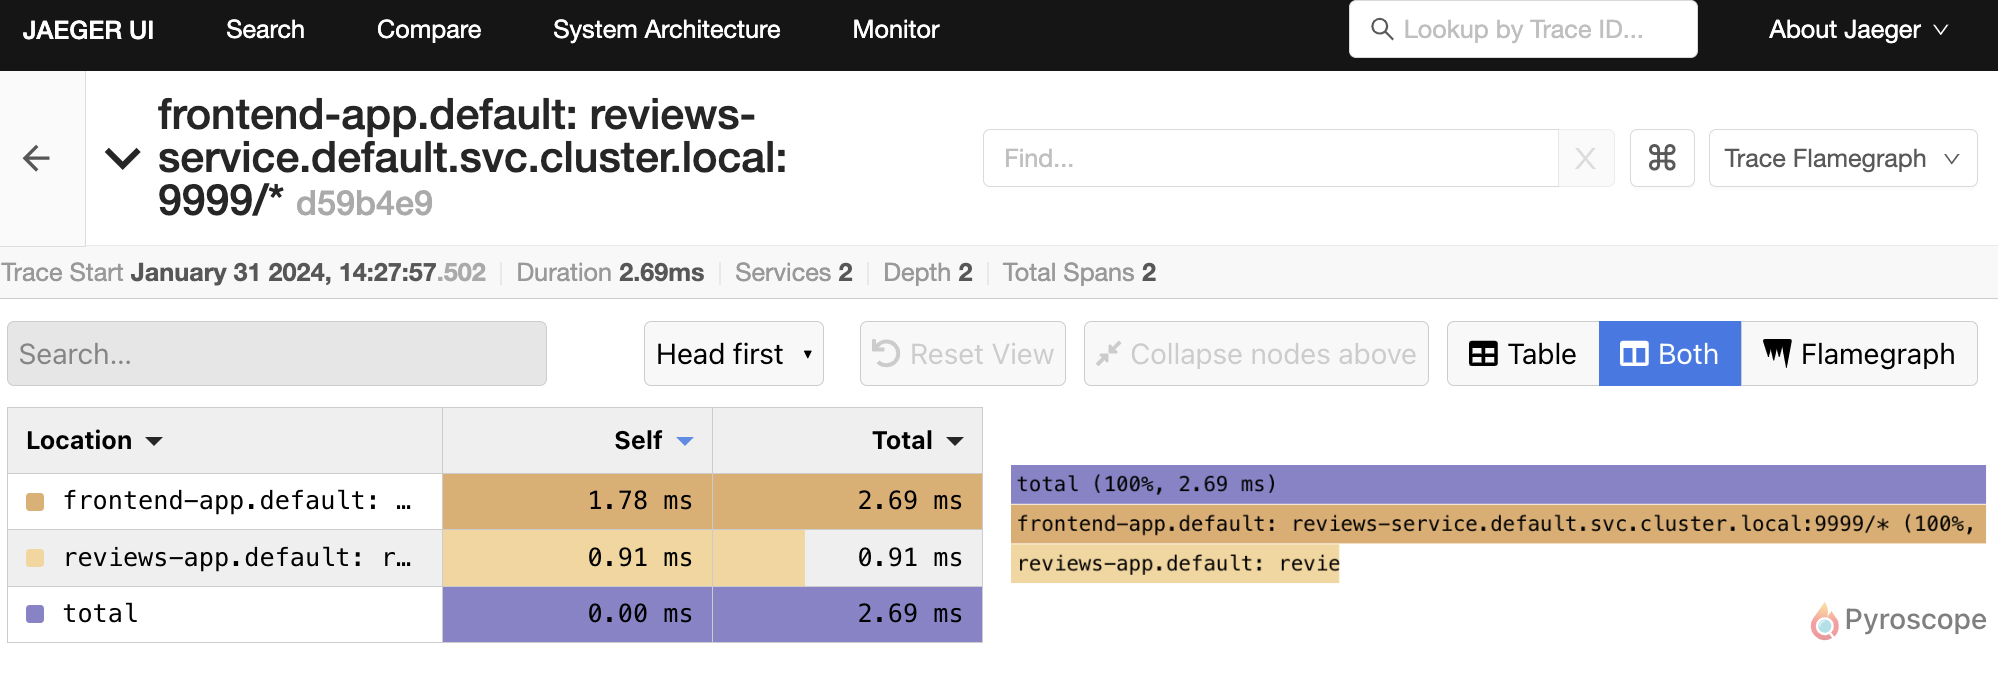
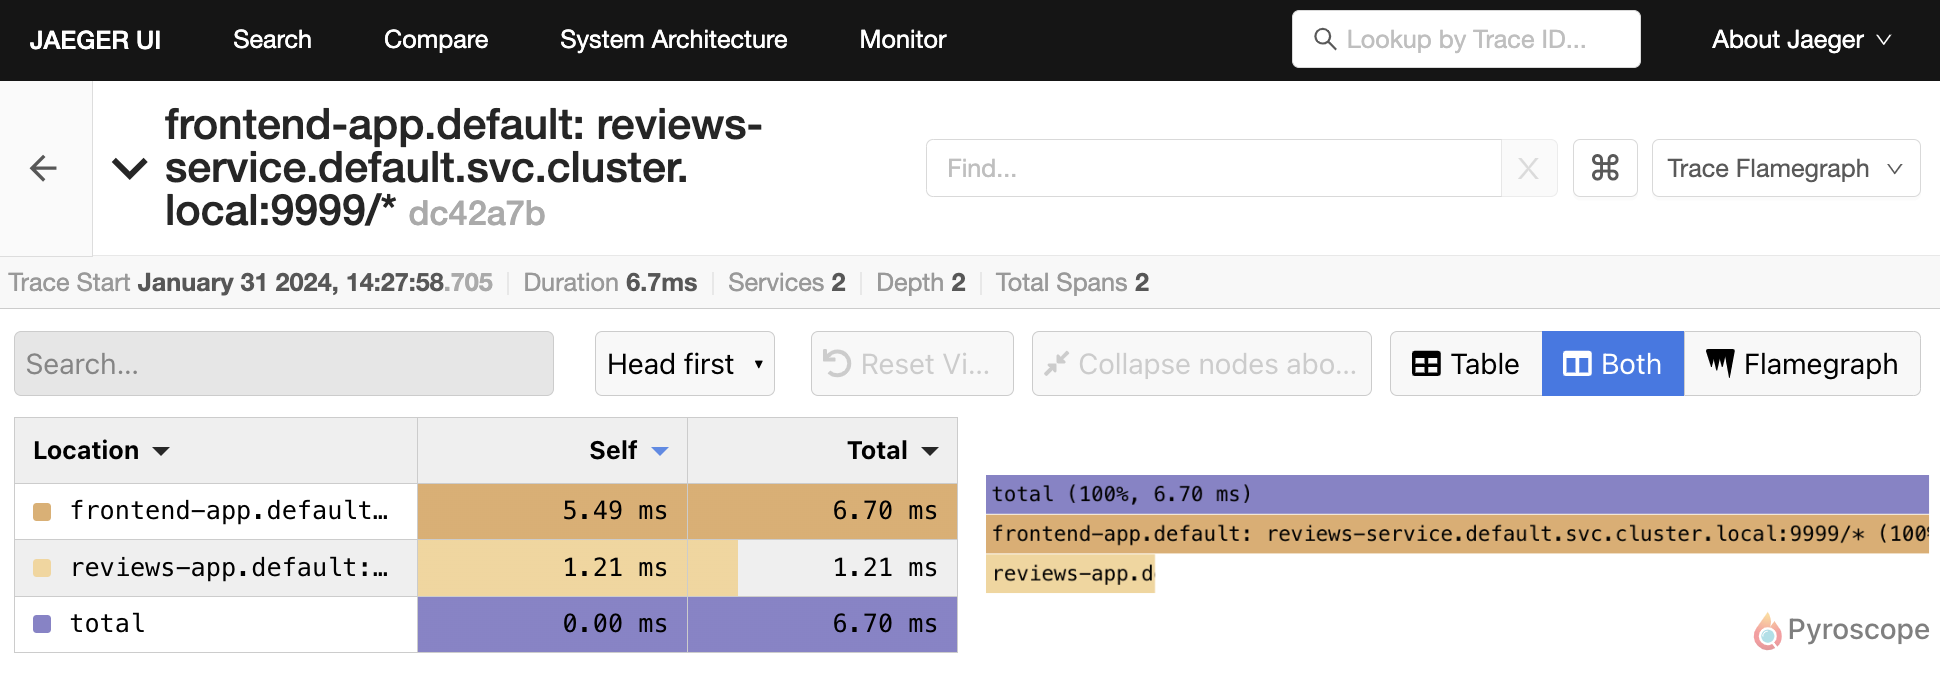
Example: We will disrupt the reviews-app by targeting the wrong port ‘1111’, and we will observe the effect as the duration time of the reviews app significantly increases.
kubectl apply -f k8s/service-mesh/demo/broken-reviews.yaml
Conclusion
In this session, we’ve explored the capabilities of observabiltiy tools, particularly Kiali and Jaeger, in providing visualizations for the service mesh. With Kiali, you gain real-time insights into your microservices architecture, enabling you to monitor network traffic, identify issues, and optimize performance. As we continue our Istio journey, stay tuned for the next article, where we delve into Istio gateway and ingress, further enhancing our mastery of traffic management and control within the service mesh. Happy exploring!