Welcome to Istio Hands-On Pt 5!
Building on the foundation of Part 1, we’re excited to take you further into the exciting world of Istio Security! If you haven’t yet, make sure to check out the earlier session on setting up your Istio environment.
Below, you’ll find the table of contents detailing the Istio hands-on lab, organized into five informative sessions:
Microservice architecture with Istio may occasionally present challenges that require adept troubleshooting and debugging skills. In this blog post, we’ll delve into the intricacies of Istio troubleshooting, providing valuable insights, tips, and techniques to help you navigate through common issues effectively.
Today, we’ll master the following topics:
For this project, we are utilizing these github repositories:
Check List
Before diving into the intricacies of debugging microservices, let’s review a comprehensive checklist to systematically identify and address potential issues. This checklist covers various aspects of Istio configuration and application setup:
| NR | Check Items | Description |
|---|---|---|
| 1 | Istio Injection | Verify that Istio sidecar proxies are correctly injected into the application pods. Check the namespace labels to ensure Istio injection is enabled. |
| 2 | Ingress Gateway | Review the Ingress Gateway configuration to ensure proper routing and external access for incoming traffic. |
| 3 | Destination Rule | Check the Destination Rule to confirm that traffic routing and load balancing rules are defined accurately. Also, ensure that only one Destination Rule is deployed. |
| 4 | Virtual Services | Inspect Virtual Services to ensure correct routing rules, timeouts, and retries for your microservices. |
| 5 | Backend App | Examine the configuration and health of the backend microservices, including any associated databases or external dependencies. |
| 6 | Frontend App | Investigate the frontend application setup, ensuring proper communication with backend services and handling of user requests. |
| 7 | Authentication | Verify the authentication settings, ensuring that secure communication is established between services. |
| 8 | Authorization | Review Authorization Policies to guarantee that access control rules are appropriately configured and aligned with your security requirements. |
| 9 | Certification Management | Check the management of certificates, including their issuance, expiration, and renewal processes. |
| 10 | Additional Checks | Include any specific checks or considerations relevant to your microservices architecture. |
By methodically going through this checklist, we can pinpoint and address potential issues, streamlining the debugging process and ensuring the smooth operation of our Istio-managed microservices.
Istio Injection
Before proceeding with Istio injection, it’s crucial to check the labels of the k8s namespace where our application resides. Istio uses labels to determine which namespaces should have its sidecar proxy injected.
NAMESPACE="default"
kubectl get ns $NAMESPACE --show-labels

# You can use istioctl check-inject too
istioctl experimental check-inject deployment/reviews-v1
istioctl x check-inject -n default -l app=reviews-app,version=v1
Ensure that the namespace has the appropriate label for Istio injection. The label typically looks like istio-injection=enabled. If this label is missing or set to a different value, Istio won’t inject its sidecar proxies into the pods within that namespace.
Istioctl
Istioctl is a powerful tool designed to help us easily debug errors in our service mesh. It offers a bunch of commands and features that allow us to check, analyze, and troubleshoot different parts of our Istio deployment.
1. Verify Install
First of all, run the command “Verify-Install” to check whether the installation was successful
istioctl verify-install
2. Analyze Config
Analyze the Istio configuration and highlighting potential issues.
NAMESPACE="default"

# Analyze the current live cluster
istioctl analyze -n $NAMESPACE

# List the analyzers available to run
istioctl analyze -L
3. Bug Report
Produce a bug-report file to archive containing all of the relevant state from our cluster.
# Genereate log files
istioctl bug-report

# Unzip the file
tar -xvzf bug-report.tar.gz

# Move to log report dir
cd /bug-report
4. Check Istio Logs
View Istio logs by executing the following command with kubectl:
kubectl logs -n istio-system -l app=istiod
To check Ingressgateway logs, use the command:
kubectl logs -l istio=ingressgateway -n istio-system
Control Plane Health and Details
To interact with the Controlz page and modify the log scope, we can use the following istioctl command:
istioctl dashboard controlz deployment/istiod.istio-system
Controlz: The Controlz endpoint provides comprehensive information about the Istio control plane’s runtime characteristics, offering insights into its health, version, memory usage, and more. This valuable resource aids in diagnosing issues and monitoring the overall well-being of Istiod.
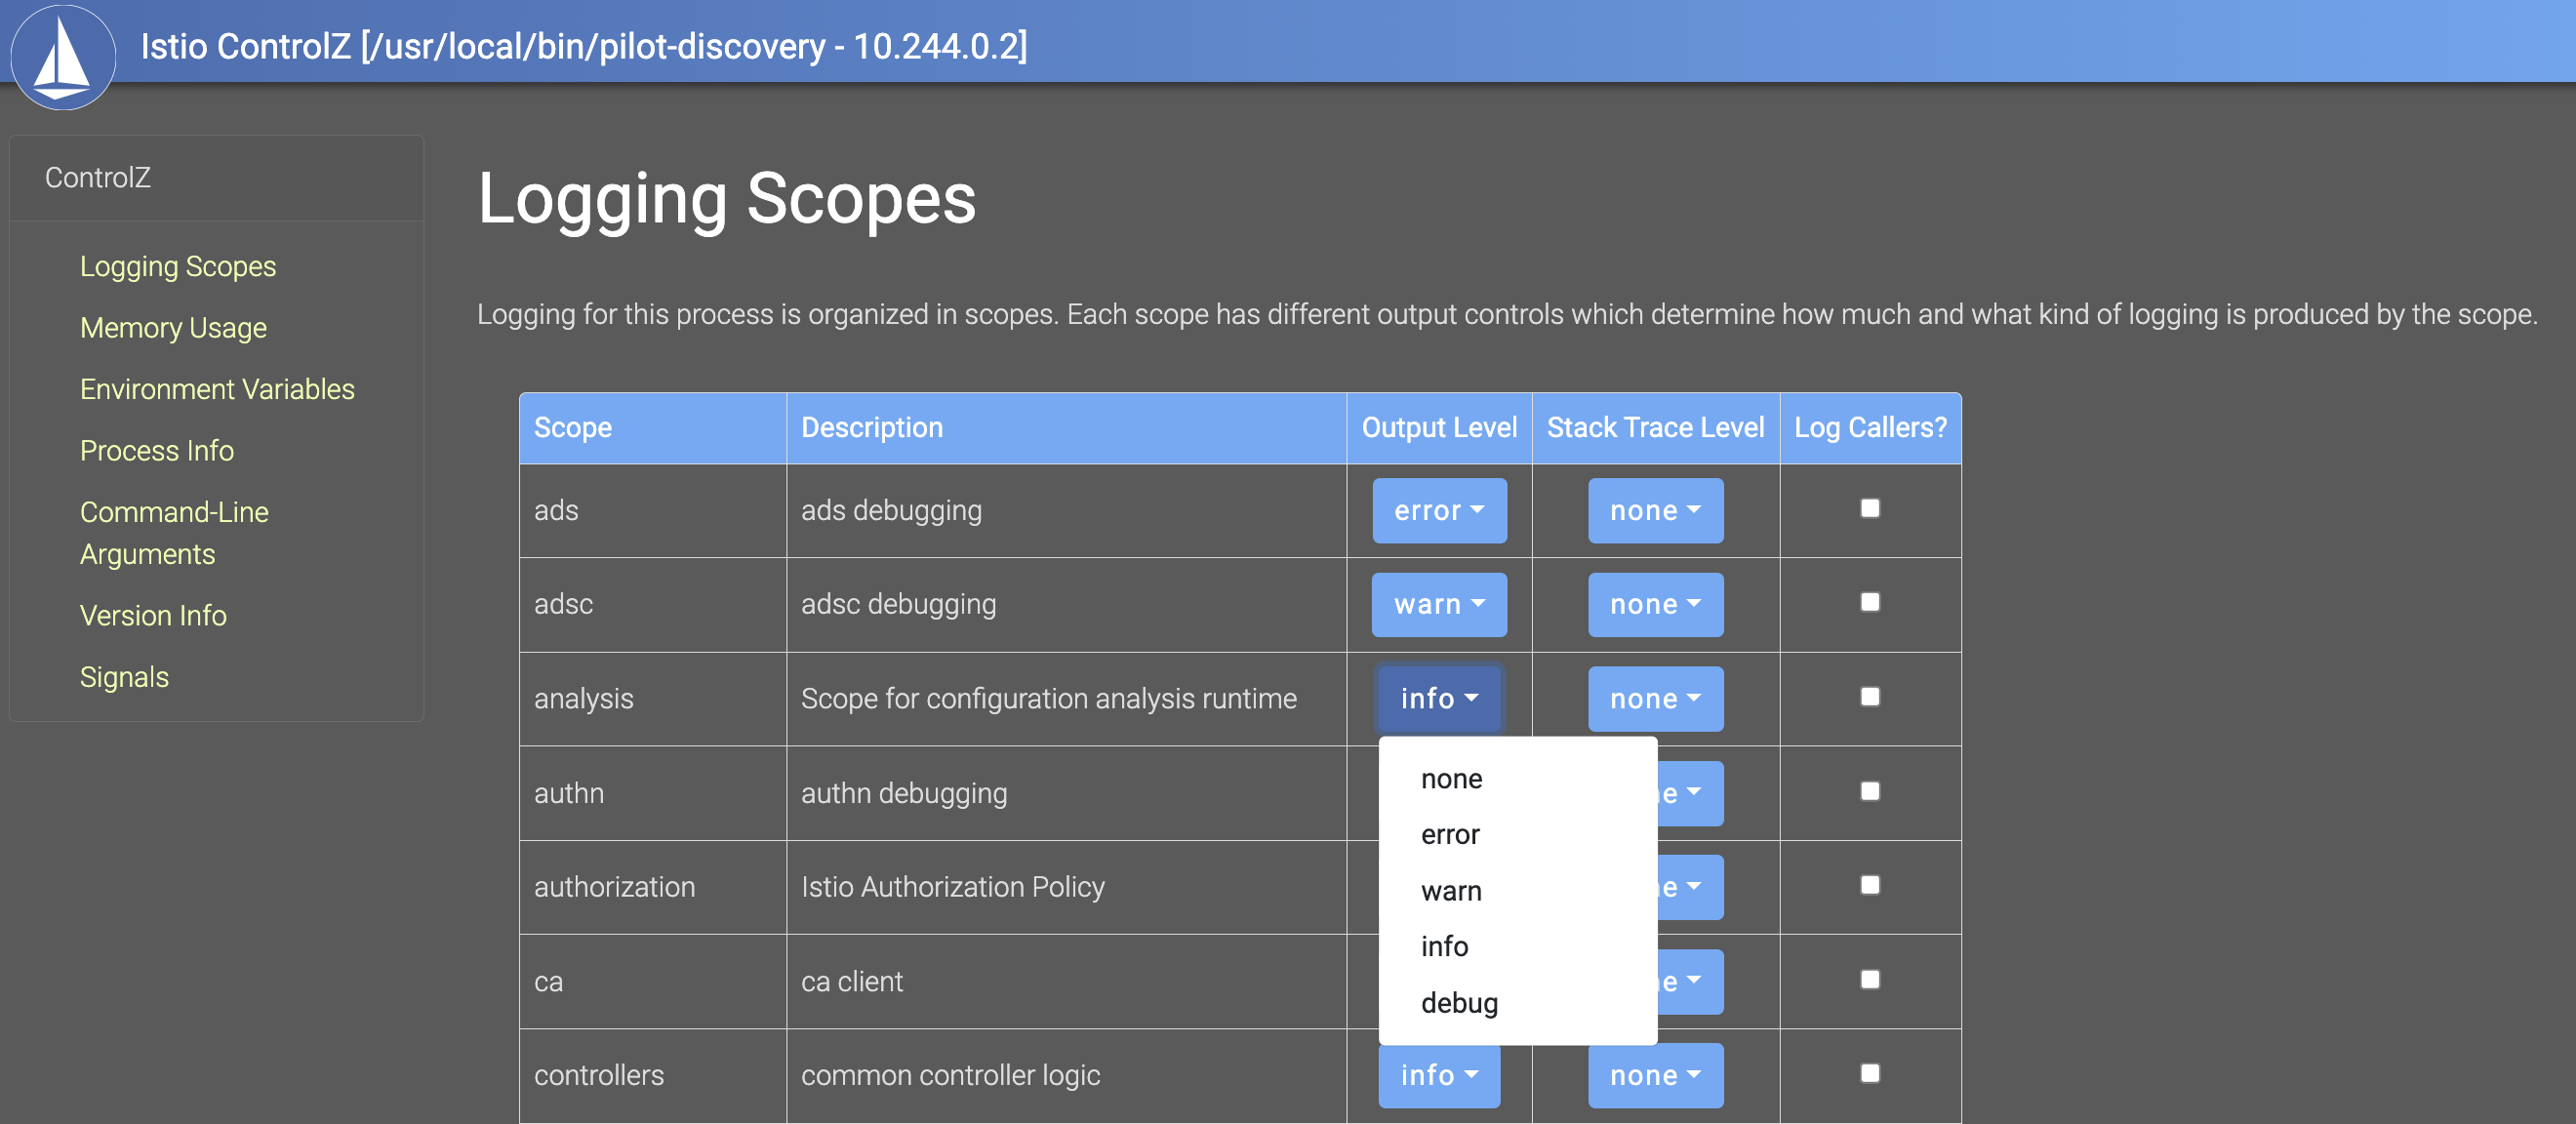
This command opens the Controlz browser page, allowing you to dynamically adjust the log scope through the user interface.
By navigating the Controlz UI, you can fine-tune logging configurations, facilitating a more detailed examination of Istiod’s runtime behavior. This feature is particularly useful for operators and developers working on Istio internals, providing a powerful tool for debugging and performance optimization.
5. Authorization
Check prints the internal org policy ‘AuthorizationPolicy’ applied to a pod by directly checking the Envoy configuration of the pod.
istioctl exp authz check $NAMESACE
istioctl exp authz check -n $NAMESACE "deploy/reviews-v1"
istioctl exp authz tls-check reviews-v1-65fd9b94cc-9k5lq.default
6. Proxy Status
Get an summary of the mesh and identify the proxy causing the problem.
istioctl proxy-status
istioctl ps

istioctl proxy-status details-v1-7bb8b7ffd9-bcwzg.default
7. Proxy Config
Inspect Envoy configuration and diagnose the issue.
istioctl proxy-config cluster -n istio-system istio-egressgateway-84776fd7f6-68rzb.istio-system

FRONTEND=$(kubectl get pod -l app=frontend-app -o jsonpath="{.items[0].metadata.name}")

istioctl proxy-config listeners $FRONTEND

# Dig In
istioctl proxy-config routes $FRONTEND --name 5000

# Dig In Deeper (allow_any route)
istioctl proxy-config routes $FRONTEND --name 5000 -o json | jq '.[].virtualHosts[]|.name,.domain'
Dry Run
Deploy an authorization policy with dry-run mode before applying it to the production traffic.
# Install Istio
bash istio-install.sh

# Create Sample Apps
kubectl create ns foo
kubectl label ns foo istio-injection=enabled
kubectl apply -f k8s/service-mesh/sample/httpbin.yaml -n foo
kubectl apply -f k8s/service-mesh/sample/sleep.yaml -n foo

# Check the debug level log for the RBAC (Role-based access control)
istioctl proxy-config log deploy/httpbin.foo --level "rbac:debug" | grep rbac

# Access httpbin via sleep app
kubectl exec "$(kubectl get pod -l app=sleep -n foo -o jsonpath={.items..metadata.name})" -c sleep -n foo -- curl http://httpbin.foo:8000/ip -s -o /dev/null -w "%{http_code}\n"
Create dry-run policy
kubectl apply -n foo -f - <<EOF
apiVersion: security.istio.io/v1
kind: AuthorizationPolicy
metadata:
  name: deny-path-headers
  annotations:
    "istio.io/dry-run": "true"
spec:
  selector:
    matchLabels:
      app: httpbin
  action: DENY
  rules:
  - to:
    - operation:
        paths: ["/headers"]
EOF
Verify
Check a request to path /headers is allowed because the policy is created in dry-run mode
for i in {1..20}; do kubectl exec "$(kubectl get pod -l app=sleep -n foo -o jsonpath={.items..metadata.name})" -c sleep -n foo -- curl http://httpbin.foo:8000/headers -H "X-B3-Sampled: 1" -s -o /dev/null -w "%{http_code}\n"; done
Check dry-run result in proxy log
kubectl logs "$(kubectl -n foo -l app=httpbin get pods -o jsonpath={.items..metadata.name})" -c istio-proxy -n foo | grep "shadow denied"
AuthorizationPolicy
To inspect and understand the AuthorizationPolicy applied to a specific pod, we can directly check the authorization policy. Sometimes, stringent policies with restrictive conditions might inadvertently block access to your application.
istioctl exp authz check -n foo deploy/sleep
Kiali
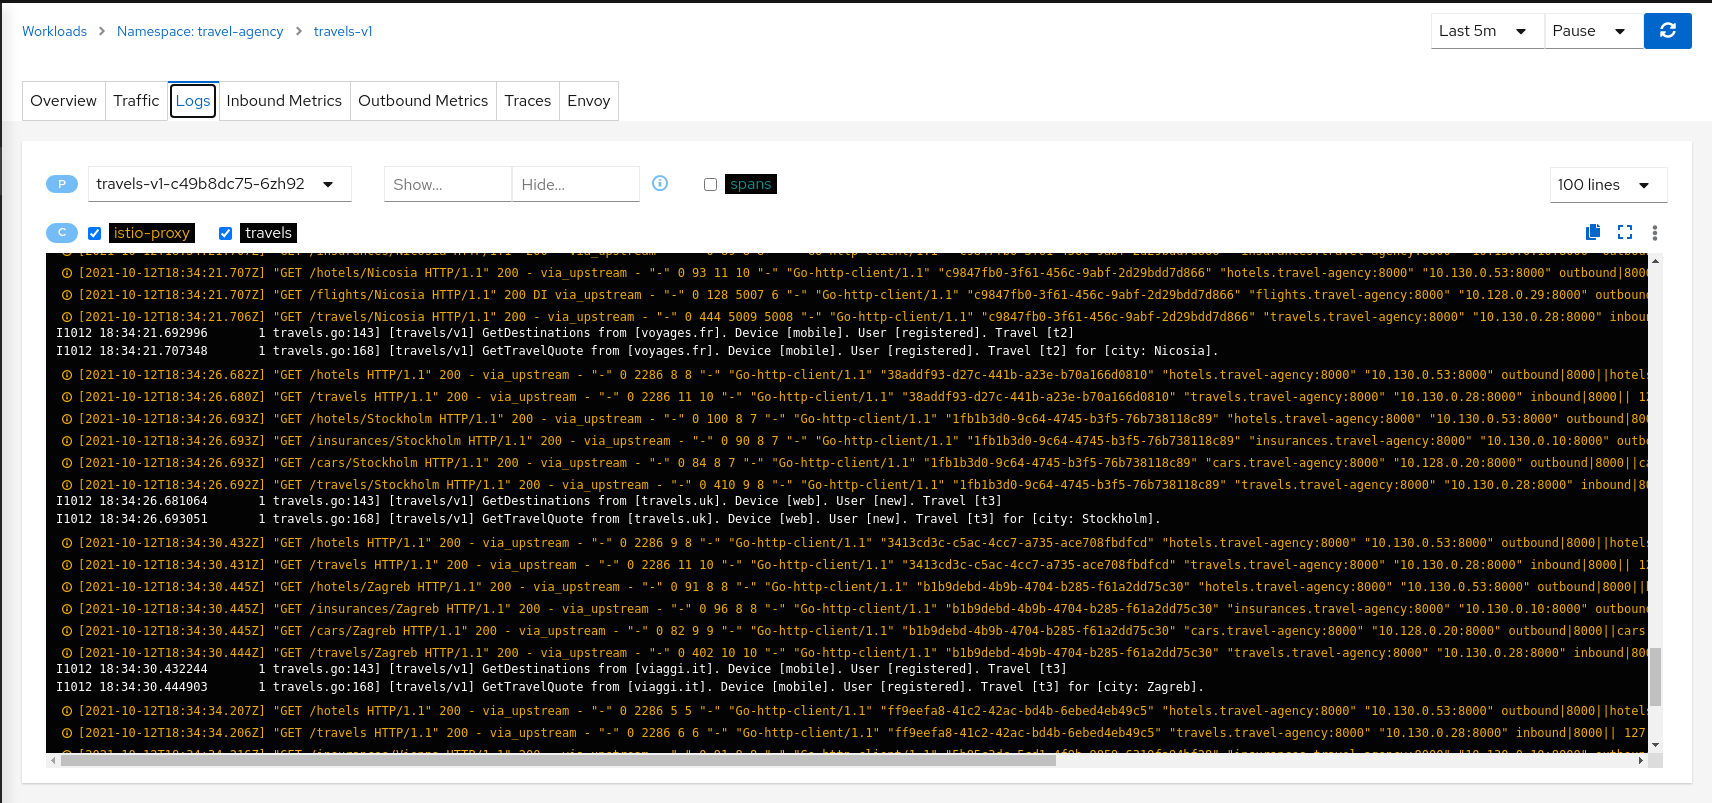
The Kiali Dashboard can serve as a valuable tool for detecting configuration errors within Istio. By navigating to the Istio Config section, we can identify potential issues.
For a more detailed analysis, we can explore the Logs tab in Kiali and search for specific logs. Kiali streamlines the debugging process by offering a unified logs view, allowing users to correlate application and proxy logs. Moreover, it integrates trace span information, aiding in the identification of critical traces associated with logging.
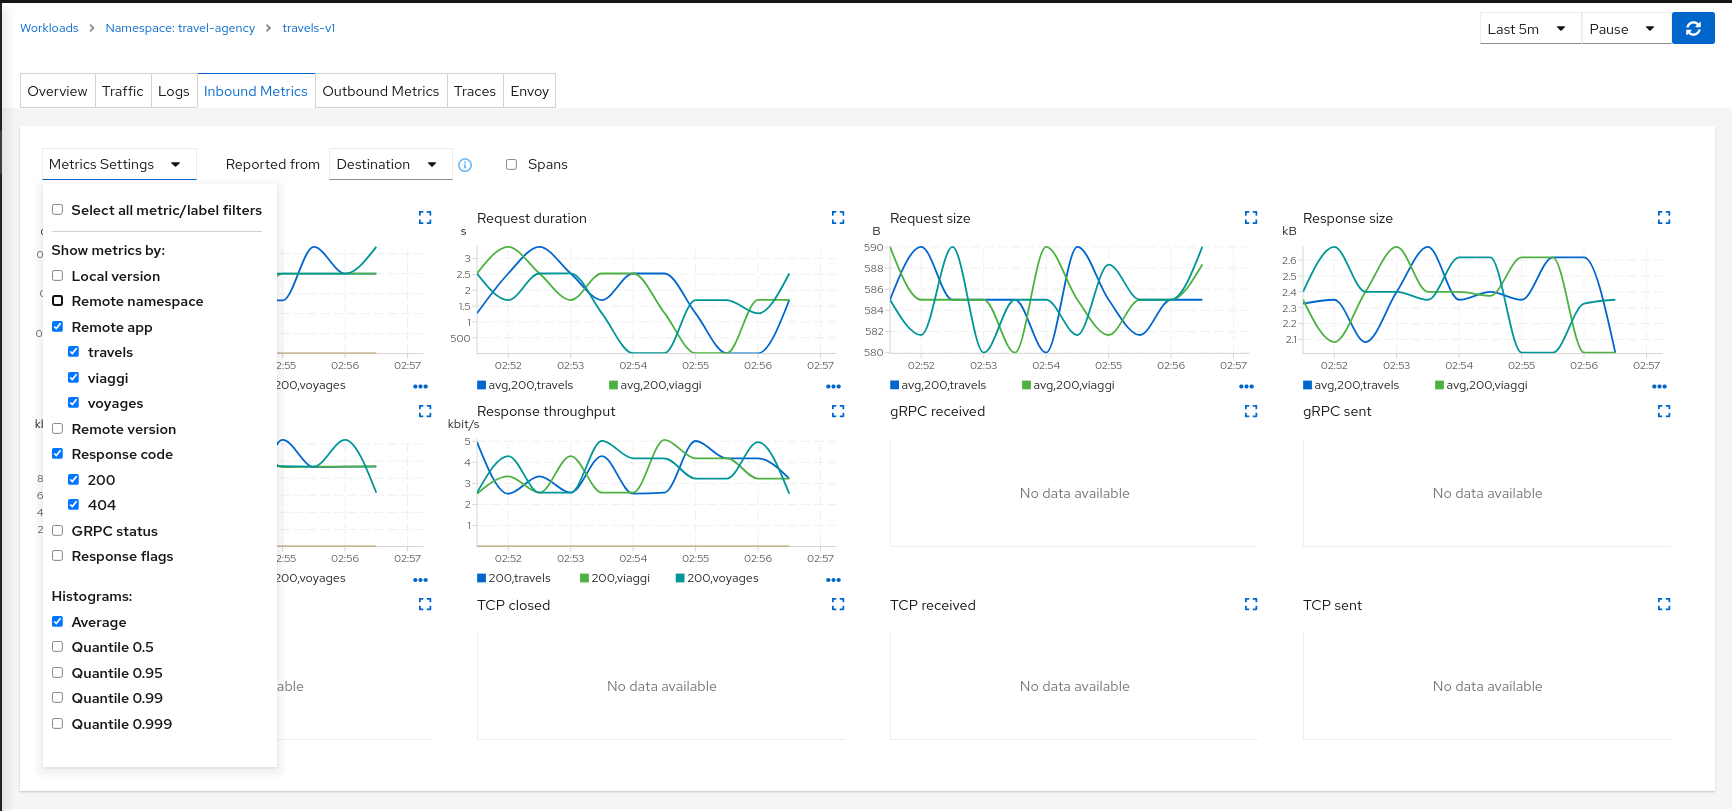
Within workload detail view, you’ll find Inbound Metrics and/or Outbound Metrics tabs, featuring predefined metric dashboards. These dashboards are customized to the relevant application, workload, or service level, providing insights into resource utilization and response errors.
K8S Logs
To assess the health of your application, you can utilize the standard Kubernetes logs command to verify if the frontend service can successfully fetch data from the backend services.
# Retrieve the name of the frontend pod
FRONTEND=$(kubectl get pod -l app=frontend-app -o jsonpath="{.items[0].metadata.name}")

# Check logs related to outbound connections from Istio proxy in the frontend pod
kubectl logs $FRONTEND -c istio-proxy | grep outbound
This command retrieves the name of the frontend pod and then extracts and displays the logs associated with outbound connections from the Istio proxy within that specific pod. Reviewing these logs can provide insights into any communication issues between the frontend and backend services.
Conclusion
In summary, our Istio troubleshooting journey has armed us with essential tools and strategies for navigating microservices intricacies. Effective troubleshooting not only identifies and resolves issues but also hinges on grasping the interconnected nature of microservices and Istio’s role in their orchestration. The provided checklist acts as a roadmap, guiding us through critical Istio configuration and application setup checkpoints, ensuring a resilient and error-free service mesh.
Check out this valuable Istio troubleshooting tutorial from Google: here.
Happy debugging and may your Istio-managed microservices thrive! 🚀