Welcome to the comprehensive guide on Kubernetes debugging. Recently, I found myself immersed in lengthy debugging sessions due to typos in Kubernetes configurations, prompting the realization of the need for a structured approach. In this post, we’ll explore the intricate world of Kubernetes troubleshooting, offering insights into best practices and strategies. By mastering these techniques, you’ll save valuable time and ensure smoother operations across your varied tasks and projects. Let’s dive in!
Debugging Overview
Before delving into Kubernetes troubleshooting, let’s discuss the fundamental process of debugging. It’s a systematic approach that demands analytical thinking, problem-solving skills, and collaboration with team members. Here’s a concise overview:
-
Understanding the Issue: Start by gathering information about the symptoms, including error messages and unexpected behavior.
-
Reproducing the Problem: Reproduce the issue to isolate its root cause and test potential solutions effectively.
-
Prioritizing Debug Issues: Prioritize debugging efforts based on the severity and impact of the issue on the system and users.
-
Isolating the Root Cause: Employ a process of elimination to isolate the underlying cause of the problem.
-
Collaboration with Co-workers: Embrace teamwork by collaborating with various team members, including developers, testers, and system administrators.
-
Testing Solutions: Develop and test potential solutions once the root cause is identified.
-
Documentation: Document the debugging process, including steps taken, findings, and implemented solutions, for future reference and knowledge sharing.
With a solid understanding of the general debugging process, we’re now equipped to dive into Kubernetes debugging and troubleshooting.
Visual Guide on Troubleshooting
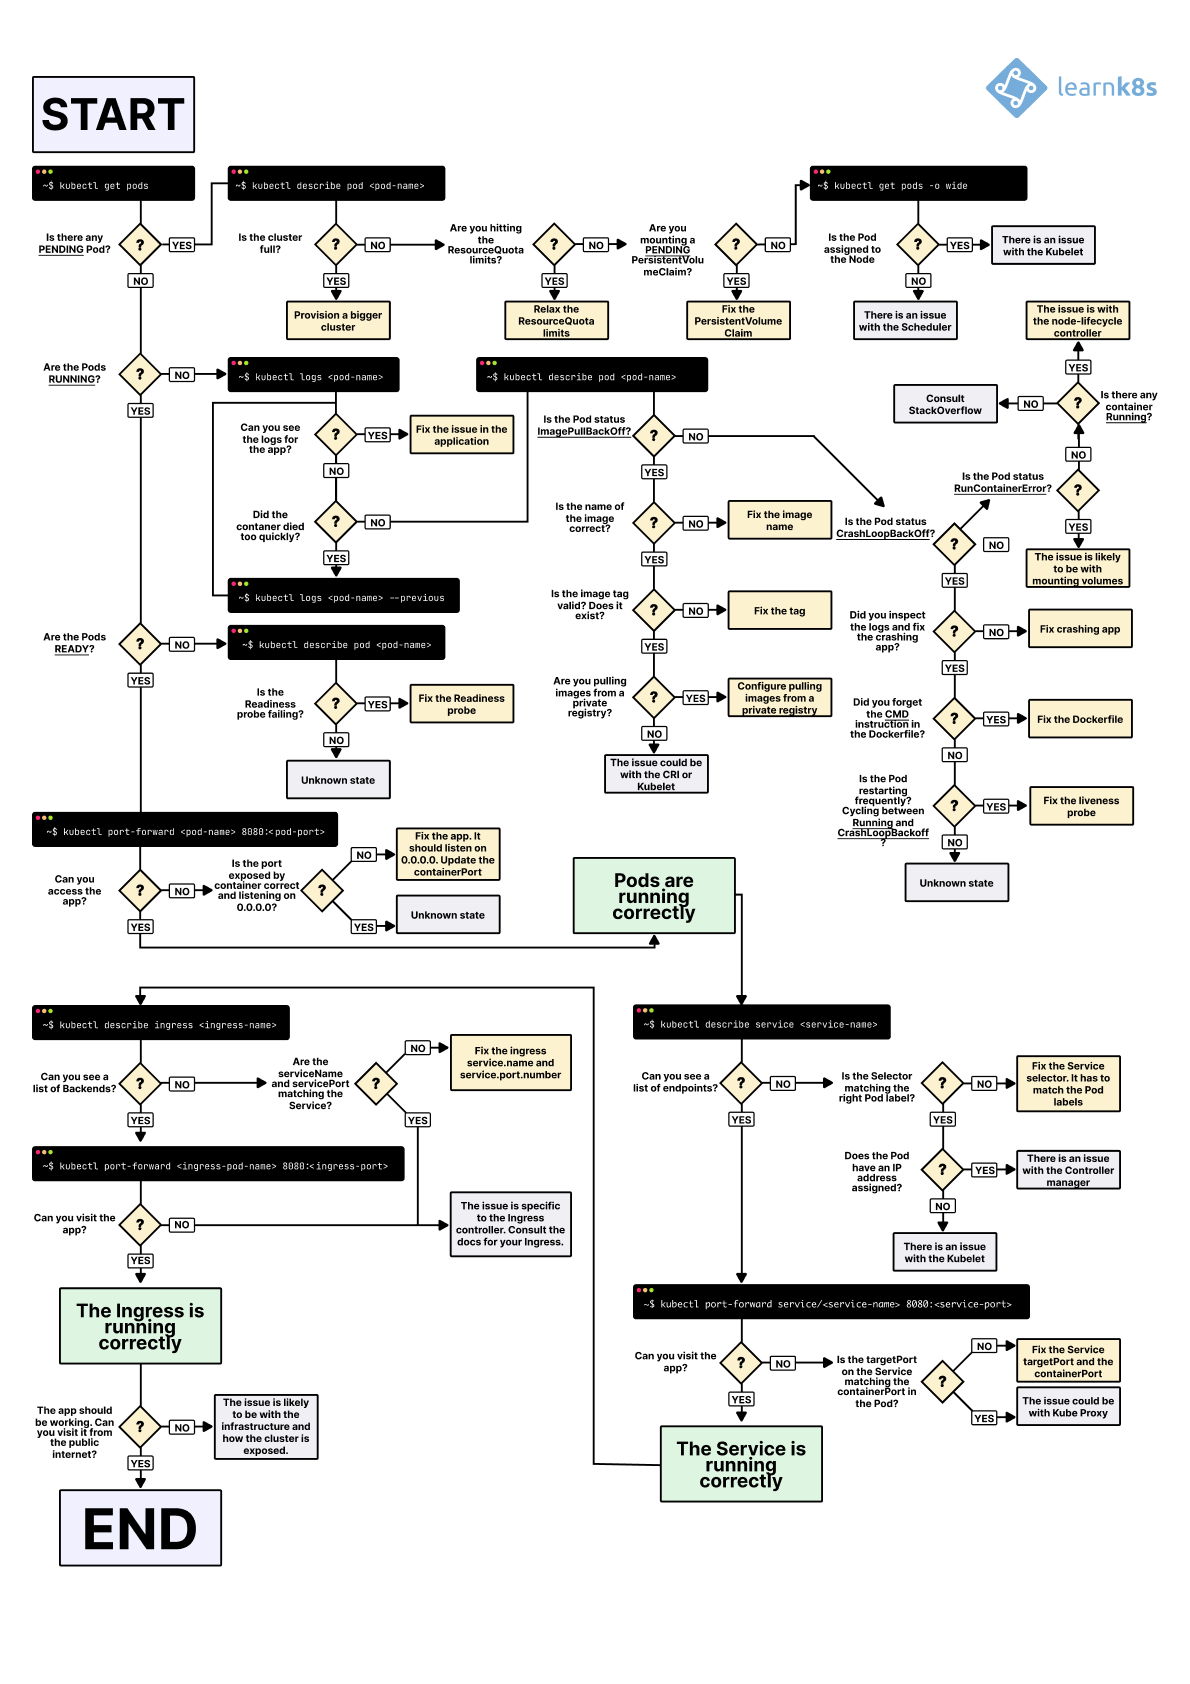
You can also refer to the diagram provided by Daniele Polencic on the Learnk8s platform (link). In this blog, debugging and troubleshooting are explained thoroughly, offering beginners step-by-step guidance.
Check List
| NR | Check Items | Description |
|---|---|---|
| 1 | Gather Info | Collect info about cluster, nodes, pods, services. |
| 2 | Validate YAML | Ensure the YAML manifest is valid and error-free. |
| 3 | Docker Image | Verify the correctness and functionality of Docker images. |
| 4 | Service Accessibility | Use kubectl port-forward to access services and validate connectivity. |
| 5 | Log Inspection | Inspect pod logs for error messages and anomalies with kubectl log. |
| 6 | Container Execution | Execute commands within containers for debugging |
| 7 | Container Debugging | Utilize kubectl debug for interactive troubleshooting |
| 8 | Health Check Configuration | Configure liveness and readiness probes to monitor container health. |
| 9 | Network Configuration | Debug Network Traffic using the netshoot container |
| 10 | Access Control Resolution | Resolve access issues for users and services, including permissions, policies, and TLS configurations. |
1. Gather Info
Before diving into debugging, it’s beneficial to gather information about the cluster, nodes, pods, services, and other relevant components.
# Check k8s cluster health
kubectl get componentstatus

# Check k8s nodes
kubectl get nodes

# Check pods
kubectl get pods  -o wide

# List all events
kubectl describe pod $POD_ID | grep -A 8 "Events:"

# Better option
kubectl get events --field-selector involvedObject.kind=Pod | grep pod/frontend
Pods can have startup and runtime errors
Startup errors include:
- ImagePullBackoff
- ImageInspectError
- ErrImagePull
- ErrImageNeverPull
- RegistryUnavailable
- InvalidImageName
Runtime errors include:
- CrashLoopBackOff
- RunContainerError
- KillContainerError
- VerifyNonRootError
- RunInitContainerError
- CreatePodSandboxError
- ConfigPodSandboxError
- KillPodSandboxError
- SetupNetworkError
- TeardownNetworkError
2. Validate YAML
Before proceeding with any further actions, it’s essential to ensure the validity of the Kubernetes manifest file af first. Occasionally, errors such as incorrect key or value names, or indentation issues, can render YAML-formatted code invalid. To verify the correctness of the manifest, you can employ the --dry-run=client flag, which allows you to perform a syntax check without actually applying the configuration changes to the cluster. This preemptive step helps prevent potential deployment failures and ensures smooth execution of subsequent actions.
kubectl create -f reviews.yaml --dry-run=client
error: error parsing reviews.yaml: error converting YAML to JSON: yaml: line 10: mapping values are not allowed in this context
These tools assist in ensuring the correctness and validity of your Kubernetes YAML files, enhancing the reliability of your configurations:
3. Docker Image
When deploying applications in Kubernetes, ensuring the correctness of Docker images and service configurations is paramount. Let’s walk through the process of validating these components within the Kubernetes environment.
- Review Kubernetes YAML File Begin by inspecting the Kubernetes YAML file to identify the Docker image and associated port number specified for the service. Here’s an example snippet:
apiVersion: v1
kind: Service
...
  ports:
    - port: 9999
      targetPort: 9999
---
...
    spec:
      serviceAccountName: reviews-sa
      containers:
        - name: reviews-app
          image: yuyatinnefeld/microservice-reviews-app:1.0.0
- Execute Docker Run To validate the Docker image’s functionality, execute the docker run command, mapping the container port to a local port:
docker run -p 9999:9999  yuyatinnefeld/microservice-reviews-app:1.0.0

curl localhost:9999
4. Service Accessibility
By following these steps, you can effectively verify the correctness of Docker images and ensure the availability of associated services within the Kubernetes cluster.
Using Curl Image to Call the App
POD_ID_1=pod-1
POD_ID_2=pod-2
# deploy 2 pods for testing
kubectl run $POD_ID_1 --image=nginx --port=80
kubectl run $POD_ID_2 --image=nginx --port=80

# check ip adress
kubectl get pods -o wide
POD_1_IP=10.244.0.4
POD_2_IP=10.244.0.3

# if container has curl
kubectl exec $POD_ID_1 --curl $POD_2_IP
kubectl exec $POD_ID_2 --curl $POD_1_IP

# if not use curlimage
kubectl debug $POD_ID_1 -it --image=curlimages/curl -- curl $POD_2_IP
kubectl debug $POD_ID_2 -it --image=curlimages/curl -- curl $POD_1_IP
Check Connectivity with the Netcat
kubectl run -i --tty --rm debug-pod --image=busybox --restart=Never -- sh
nc -zv -w 3 10.244.0.4 80
10.244.0.4 (10.244.0.4:80) open
nc -zv -w 3 10.244.0.3 80
10.244.0.3 (10.244.0.3:80) open

# check the respond with headers
echo -e "HEAD / HTTP/1.1\r\nHost: 10.244.0.3\r\n\r\n" | nc -i 1 10.244.0.3 80

# check the respond with headers & body
echo -e "GET / HTTP/1.1\r\nHost: 10.244.0.3\r\n\r\n" | nc 10.244.0.3 80
Using Port Forward
SVC=$(kubectl get svc -l service=frontend -o jsonpath="{.items[0].metadata.name}")
POD_ID=$(kubectl get pod -l app=frontend-app -o jsonpath="{.items[0].metadata.name}")

# Check pod
kubectl port-forward pod/$POD_ID 5555:5000
curl localhost:5555

# Check service
kubectl port-forward svc/$SVC 5000
curl localhost:5000
5. Log Inspection
Pod logs provide valuable insights into the behavior of applications running within Kubernetes pods. You can retrieve these logs using the kubectl logs command:
POD_ID=$(kubectl get pod -l app=frontend-app -o jsonpath="{.items[0].metadata.name}")
kubectl logs $POD_ID
By inspecting pod logs, you can identify errors, warnings, or other messages that help pinpoint issues within your application.
6. Container Execution
In some cases, you may need to execute commands directly within a container to further investigate issues. Kubernetes provides the exec command for this purpose:
Using exec -it, you can run an interactive shell within the container, allowing you to execute commands and explore its environment.
However, it’s essential to note that not all containers may contain the necessary tools for debugging. Attempting to run commands like ps or top within a container may result in errors if these tools are not installed:
kubectl exec -it $POD_ID -- sh

# Error: Container doesn't contain 'ps' tool
kubectl exec -it $POD_ID -- ps

# Error: Container doesn't contain 'top' tool
kubectl exec -it $POD_ID -- top
A preferable alternative is kubectl debug. With this option, there’s no need to manipulate the original pod. Instead, an ephemeral container is utilized for debugging purposes, ensuring that the original container remains untouched.
7. Container Debugging
Ephemeral containers are useful for interactive troubleshooting when kubectl exec is insufficient because a container has crashed or a container image doesn’t include debugging utilities, such as with distroless images.
Deploying the Sample Application
Let’s deploy a sample application to demonstrate debugging scenarios:
kubectl apply -f - <<EOF
apiVersion: v1
kind: ConfigMap
metadata:
  name: server
data:
  server.js: |
    const http = require('http');
    const server = http.createServer((req, res) => {
      res.statusCode = 200;
      res.end('hello sample app!\n');
    });
    server.listen(8080, '0.0.0.0', () => console.log('Server running'));
---
apiVersion: v1
kind: Pod
metadata:
  name: sample-app
spec:
  containers:
    - name: sample-app
      image: gcr.io/distroless/nodejs:16
      ports: [ { name: http, containerPort: 8080 } ]
      args: [ "/app/server.js" ]
      volumeMounts: [ { mountPath: /app, name: server } ]
  volumes:
    - name: server
      configMap:
        name: server
EOF
Accessing the Sample App
Attempt to access the sample app, which may result in an error due to the absence of a shell within the Distroless container.
POD_ID="sample-app"
kubectl exec $POD_ID -it -- sh
OCI runtime exec failed: exec failed: unable to start container process: exec: "sh": executable file not found in $PATH: unknown
command terminated with exit code 126
Copying Sample App and Debugging from Sidecar Container
Create a copy of the sample-app and add a new Alpine container named debug-sample-app for debugging:
kubectl debug $POD_ID -it --image=alpine --share-processes --copy-to debug-sample-app -- sh
Inspect the processes and files within the container:
ps x

PID=8
ls -l /proc/$PID/root/app

cat /proc/$PID/root/app/server.js
Cleaning Up the Debug Apps
kubectl delete pod debug-sample-app
8. Health Check Configuration
Ensuring the health and availability of containers running in Kubernetes is paramount for maintaining the reliability of your applications.
It’s crucial to configure both liveness and readiness probes in your Kubernetes deployment manifests. Without proper configuration, your containers may face issues such as endless restart loops or being prematurely included in service pools.
Defining a Liveness Probe
The livenessProbe monitors the health of a container and determines if it should be restarted. It’s essential to include this probe to ensure that unhealthy containers are automatically restarted.
spec:
  containers:
  ...
    livenessProbe:
      httpGet:
        path: /health
        port: 8080
        httpHeaders:
        - name: Custom-Header
          value: Awesome
To verify the configuration, check the result using the following command:
POD_ID="frontend-v1-65db68c8b-8vbjg"
kubectl describe $POD_ID | grep -i liveness
Defining a Readiness Probe
The readinessProbe checks if a container is ready to receive traffic. This probe ensures that only healthy containers are included in the service pool to avoid serving traffic to unhealthy instances.
spec:
  containers:
  ...
    readinessProbe:
      tcpSocket:
        port: 8080
      initialDelaySeconds: 15
      periodSeconds: 10
To verify the configuration, check the result using the following command:
POD_ID="frontend-v1-65db68c8b-8vbjg"
kubectl describe $POD_ID | grep -i readiness
9. Network Configuration
Network troubleshooting in Kubernetes can be challenging, especially when pods lack necessary commands. Netshoot acts like a Swiss Army knife for network debugging, offering a comprehensive set of network commands to test connectivity across your cluster.
Start netshoot
POD_ID="frontend-v1-65db68c8b-8vbjg"
NS="default"

# run netshoot container
kubectl debug -it -n $NS $POD_ID --image=nicolaka/netshoot --image-pull-policy=Always
Check IP Config
ifconfig

ip route

default via 10.244.0.1 dev eth0
10.244.0.0/16 dev eth0 proto kernel scope link src 10.244.0.18

ping 10.244.0.1

ip neigh show
10.244.0.2 dev eth0 lladdr 6a:a3:3e:a2:54:92 STALE
10.244.0.1 dev eth0 lladdr 16:4f:6d:25:c9:85 REACHABLE
Display the network status and protocol statistics with netstat
# gernerate a few traffics
kubectl port-forward svc/frontend-service 5000
curl localhost:5000

netstat

Active Internet connections (w/o servers)
Proto Recv-Q Send-Q Local Address           Foreign Address         State
tcp        0      0 frontend-v1-68d64c66df-s9hcr:34518 details-service.default.svc.cluster.local:7777 TIME_WAIT
tcp        0      0 frontend-v1-68d64c66df-s9hcr:5000 10.244.0.1:42196        TIME_WAIT
tcp        0      0 localhost:5000          localhost:45372         TIME_WAIT
tcp        0      0 localhost:45370         localhost:5000          TIME_WAIT
tcp        0      0 frontend-v1-68d64c66df-s9hcr:54204 reviews-service.default.svc.cluster.local:9999 TIME_WAIT
tcp        0      0 frontend-v1-68d64c66df-s9hcr:39470 payment-service.default.svc.cluster.local:8888 TIME_WAIT
Active UNIX domain sockets (w/o servers)
Capture packets from a live TCPnetwork with tcpdump
# list interfaces
tcpdump -D

# display all interfaces
tcpdump -i any -c 5

# display only first ethernet interface
tcpdump -i eth0 -c 5

tcpdump: verbose output suppressed, use -v[v]... for full protocol decode
listening on eth0, link-type EN10MB (Ethernet), snapshot length 262144 bytes
09:05:54.021259 IP 10.244.0.1.47686 > frontend-v1-68d64c66df-q6c7n.5000: Flags [S], seq 1574929709, win 64240, options [mss 1460,sackOK,TS val 3236677810 ecr 0,nop,wscale 7], length 0
09:05:54.021305 IP frontend-v1-68d64c66df-q6c7n.5000 > 10.244.0.1.47686: Flags [S.], seq 4011247834, ack 1574929710, win 65160, options [mss 1460,sackOK,TS val 2761942823 ecr 3236677810,nop,wscale 7], length 0
09:05:54.021395 IP 10.244.0.1.47686 > frontend-v1-68d64c66df-q6c7n.5000: Flags [.], ack 1, win 502, options [nop,nop,TS val 3236677811 ecr 2761942823], length 0
09:05:54.022039 IP 10.244.0.1.47688 > frontend-v1-68d64c66df-q6c7n.5000: Flags [S], seq 642112599, win 64240, options [mss 1460,sackOK,TS val 3236677811 ecr 0,nop,wscale 7], length 0
09:05:54.022080 IP frontend-v1-68d64c66df-q6c7n.5000 > 10.244.0.1.47688: Flags [S.], seq 254269054, ack 642112600, win 65160, options [mss 1460,sackOK,TS val 2761942823 ecr 3236677811,nop,wscale 7], length 0
5 packets captured
21 packets received by filter
0 packets dropped by kernel
Understanding the output format
09:05:54.022080 IP frontend-v1-68d64c66df-q6c7n.5000 > 10.244.0.1.47688: Flags [S.], seq 254269054, ack 642112600, win 65160, options [mss 1460,sackOK,TS val 2761942823 ecr 3236677811,nop,wscale 7], length 0

<TIME_STAMP> <NETWORK_LAYER> <SOURCE_IP> <DESTIONATION_ID> <FLAG> <NUM_CONTAINED_BYTES> <NUM_NEXT_EXPECTED_BYTES> <NUM_WINDOWSIZE_BYTE> <OPTIONAL> <LENGTH OF PAYLOAD DATA>
FLAG
- S (SYN) = Connection Start
- F (FIN) = Connection Finish
- P (PUSH) = Data Push
- R (RST) = Connection reset
- . (ACK) = Acknowledgment
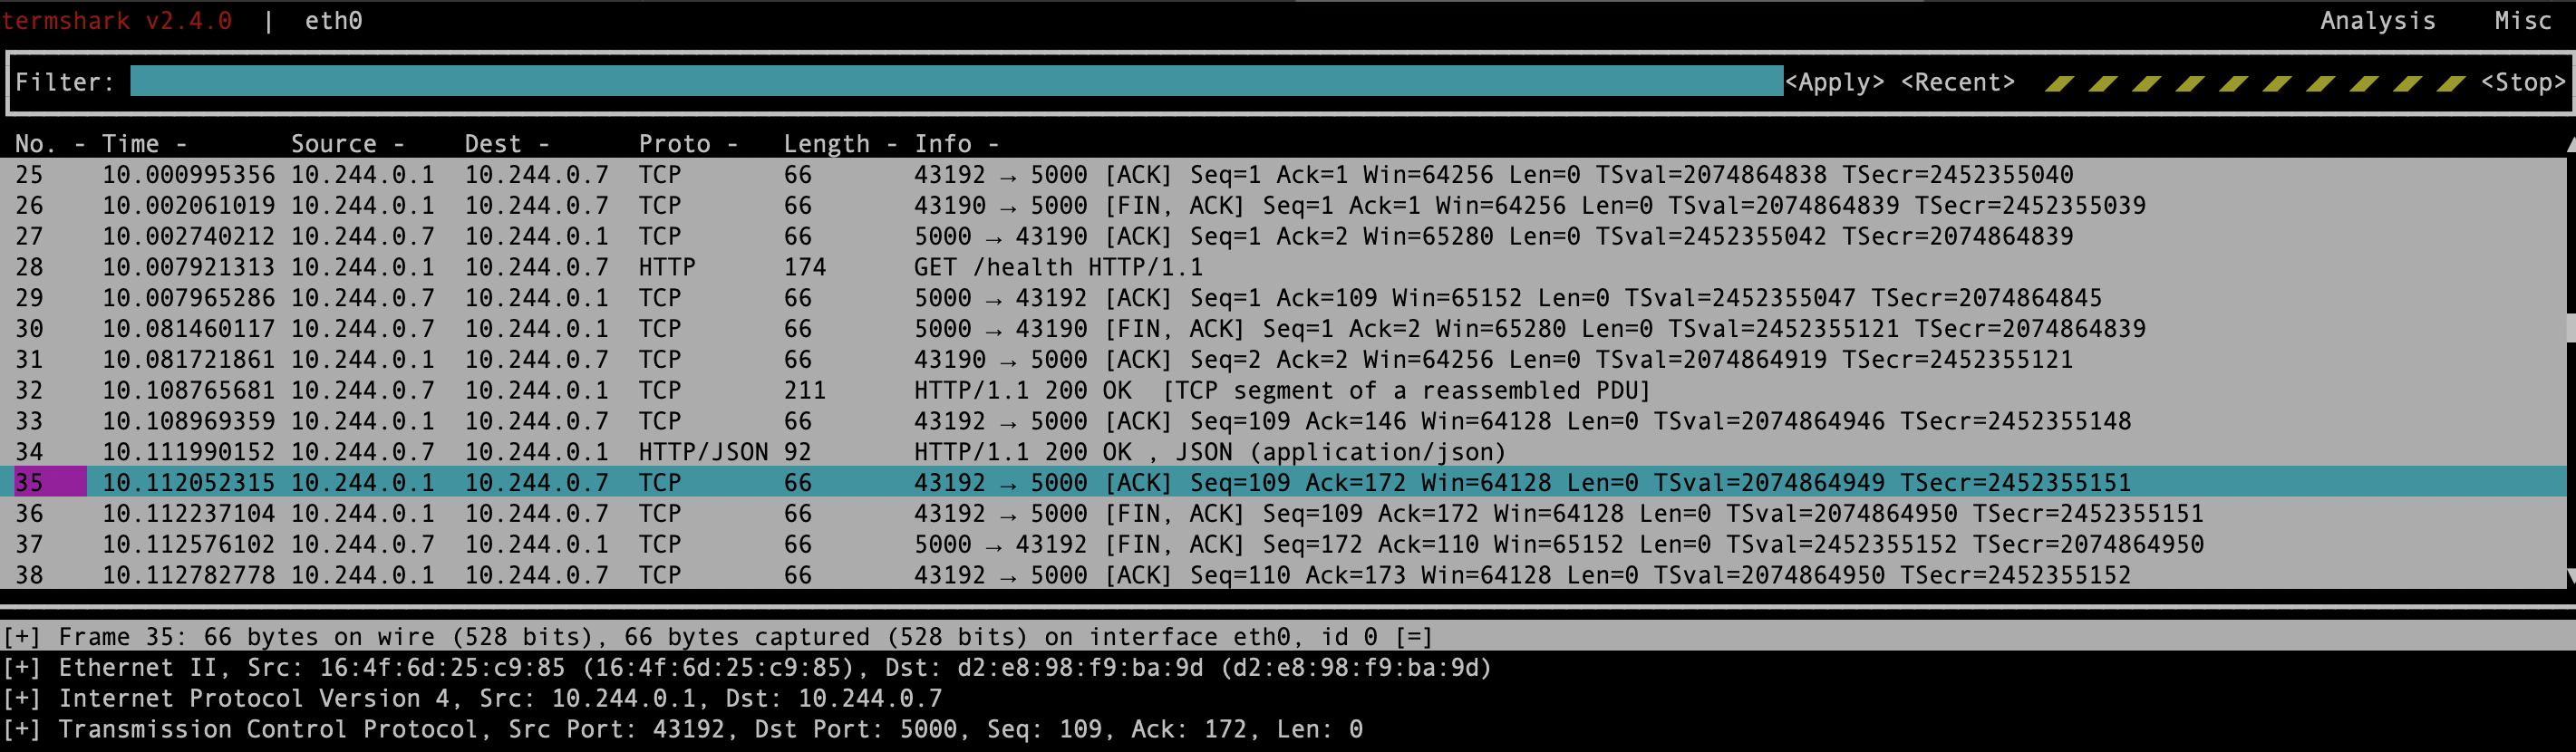
Launch the Package Analyze UI with termshark
Termshark provides a user-friendly, terminal-based interface for analyzing packet captures, making it accessible directly from the command line without needing a graphical environment.
# Launch termshark with read mode
termshark -i eth0
10. Access Control Resolution
Check permissions
# Check if a user can create deployments
kubectl auth can-i create deployments --namespace dev

# Check if a permission-specific user user can create deployments
kubectl auth can-i create deployments --namespace dev --as=user@example.com

# Check if a user can list pods in the default namespace
kubectl auth can-i list pods --namespace=default --as=user@example.com

# Check if a service account can delete deployments in a specific namespace
kubectl auth can-i delete deployments --namespace=my-namespace --as=system:serviceaccount:my-namespace:my-serviceaccount
List RBAC Resources
kubectl get roles --all-namespaces
kubectl get rolebindings --all-namespaces
kubectl get clusterroles
kubectl get clusterrolebindings
Describe RBAC Resources
kubectl describe role <role-name> -n <namespace>
kubectl describe rolebinding <rolebinding-name> -n <namespace>
kubectl describe clusterrole <clusterrole-name>
kubectl describe clusterrolebinding <clusterrolebinding-name>
Review Service Accounts
kubectl get serviceaccounts --all-namespaces
kubectl describe serviceaccount <serviceaccount-name> -n <namespace>
Conclusion
As Kubernetes continues to evolve and grow in popularity, mastering these debugging techniques becomes increasingly essential for maintaining the reliability and performance of microservices. With the knowledge gained from this blog post, readers are well-equipped to tackle the challenges of debugging in Kubernetes confidently.
I hope that the insights shared here empower you to overcome obstacles, optimize your Kubernetes deployments, and embark on a journey of continuous improvement in your containerized environments. Happy debugging!
Happy debugging and trouble shooting! 🚀