In this fourth session of the Istio Advanced series, we dive into the heart of service discovery within the Istio control plane. Service discovery is crucial for enabling microservices to communicate dynamically in a Kubernetes environment.
⚙️ Requirements
Before proceeding, ensure the following pods are up and running in your Kubernetes cluster:
- sleep pod is running
- helloworld pod is running
- istiod pod is running
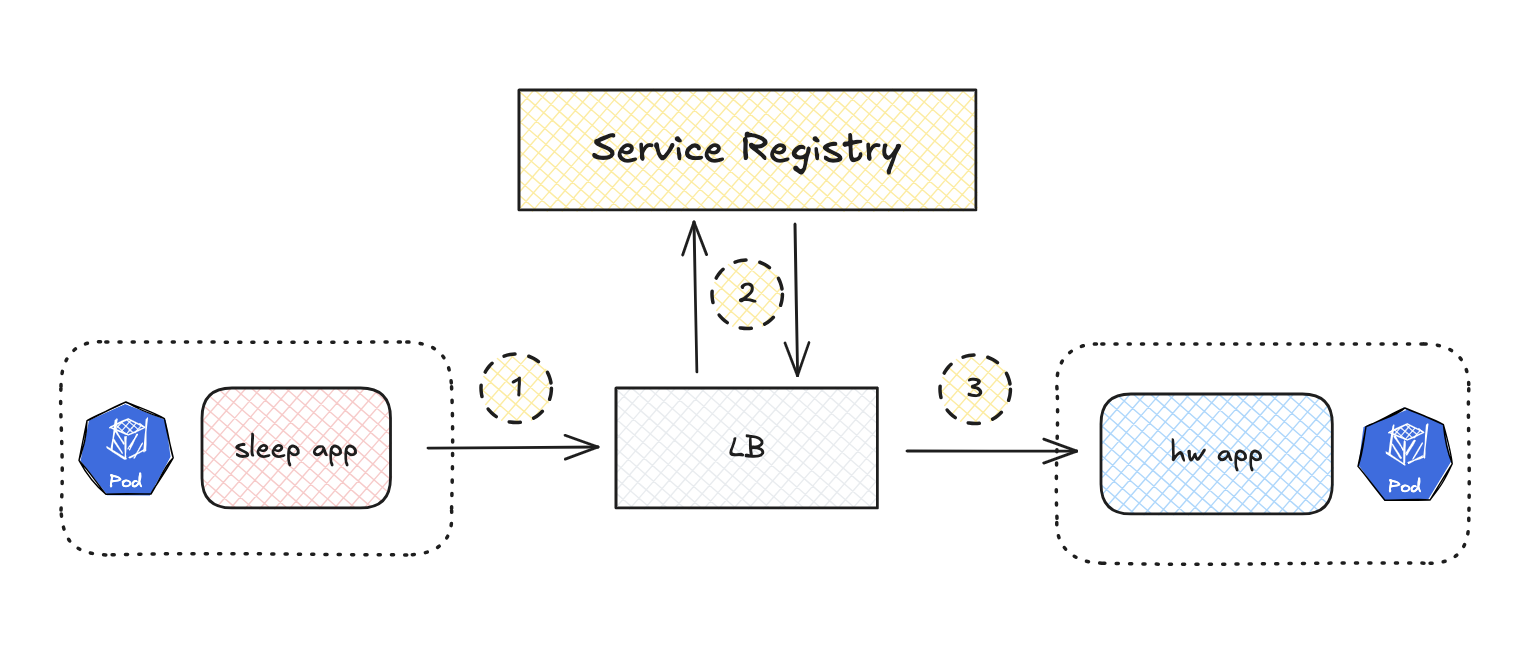
🔎 Severside Discovery

Service discovery is a key component of microservices architecture. It is the process of automatically identifying network locations (i.e., IP addresses and ports) of services so that communication between them can happen efficiently. In a dynamic environment, where services are constantly starting, stopping, scaling, and changing, service discovery ensures that service consumers (clients) can find the correct instances of the services they depend on. Without service discovery, managing service interactions would be cumbersome and prone to failure due to hardcoded addresses, making scaling and failure recovery difficult.
Step-by-Step:
Step 1: Client sends a request.
The sleep app (which is one microservice) makes a request, but it doesn’t know the exact address of the hw-v1 app (another microservice). Instead of the client managing service discovery, the request first goes to a load balancer (like a reverse proxy or API gateway), which will handle the routing.
Step 2: LB queries the Service Registry.
The LB queries the service registry to find the current location of the hw-v1 pod. The service registry contains a list of all active instances of microservices, along with their IP addresses and ports.
Step 3: Response flows back to “sleep app”.
The LB selects an available instance of hw app (e.g., based on round-robin, least connections, or another strategy) and forwards the request from the sleep app to this specific instance of the hw app.
🕵🏻♂️ Istio Discovery

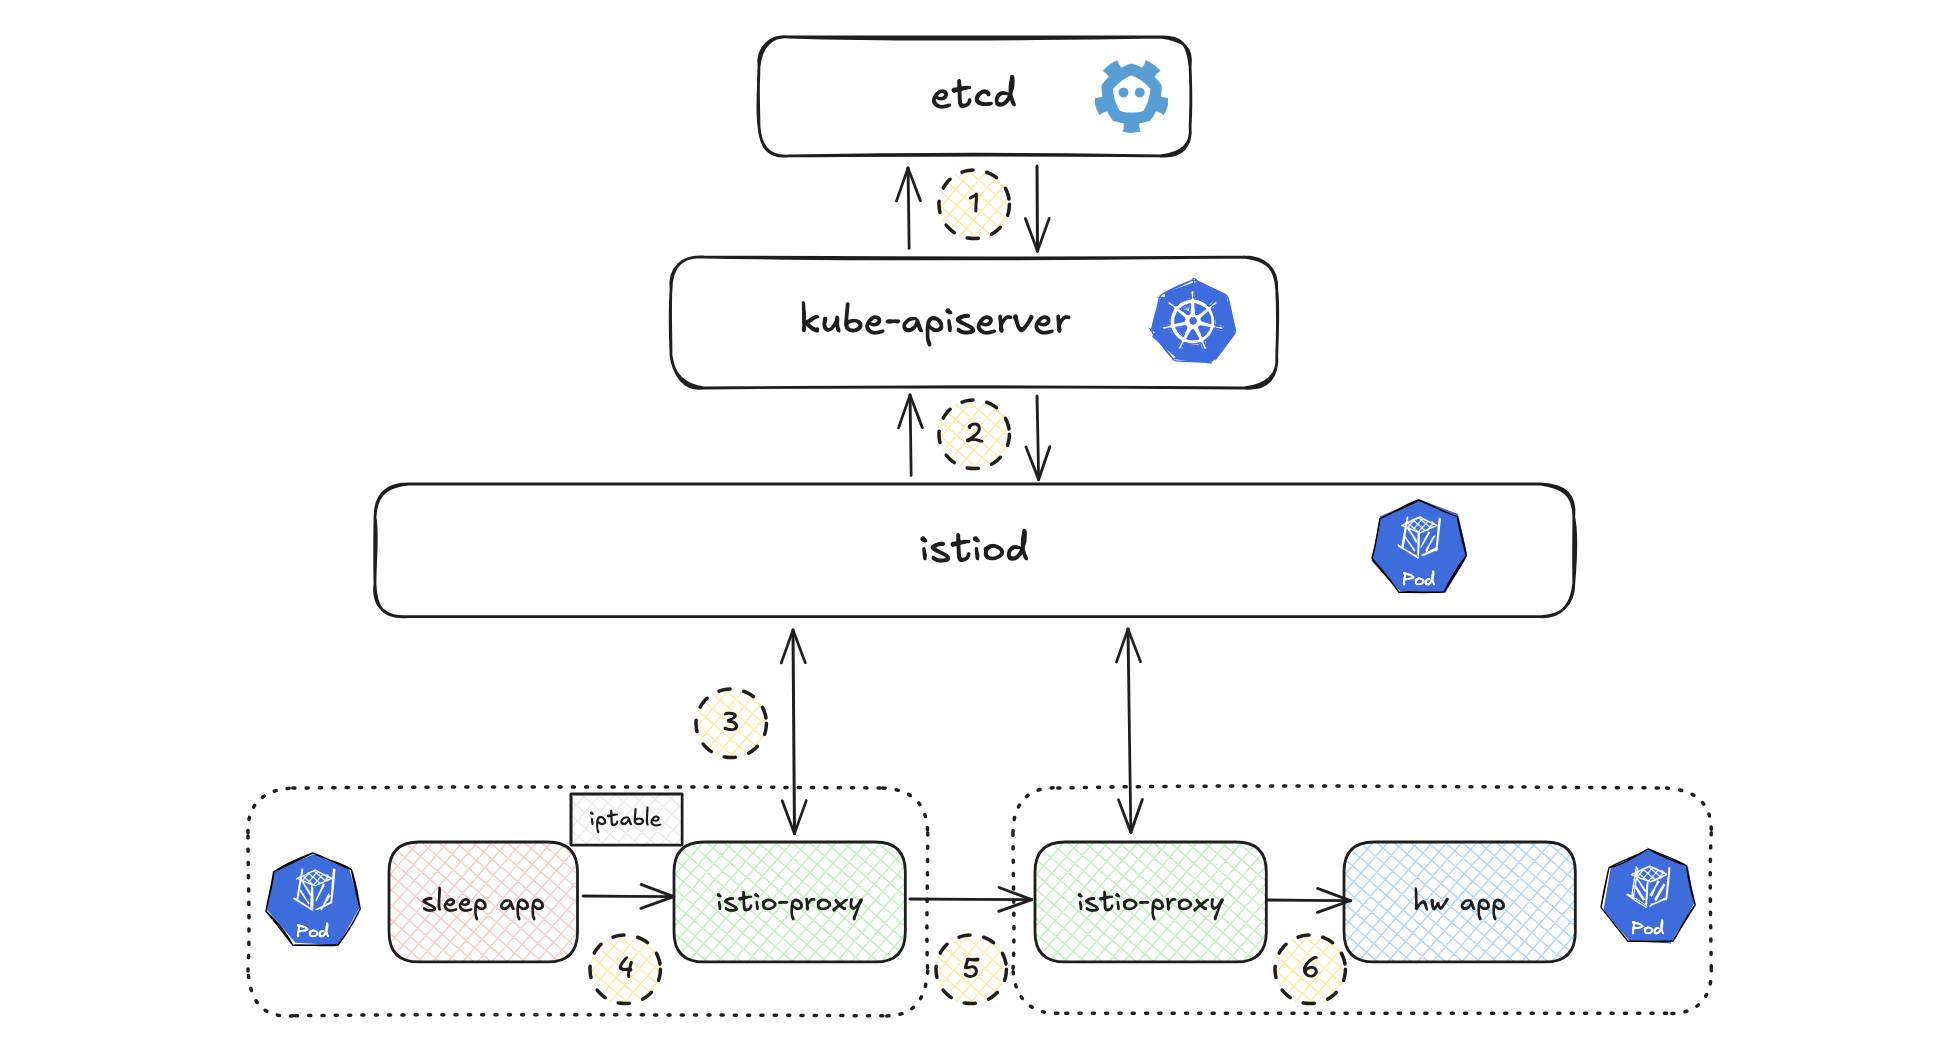
In Istio, the service discovery process involves communication between istiod (the discovery component) and the istio-proxy container running Envoy. The interaction between the control plane and the data plane—via proxies—is fundamental for routing requests and discovering services.
Create traffic to simplate szenario from the sleep pod to the hw-v1 service:
SOURCE_POD=$(kubectl get pod -l app=sleep -n application -o jsonpath={.items..metadata.name})
TARGET_POD=$(kubectl get pod -l app=hw-v1 -n application -o jsonpath={.items..metadata.name})
TARGET_URL="dest-svc-v1.application.svc.cluster.local:7777"
kubectl exec "$SOURCE_POD" -c sleep -- curl -sSI $TARGET_URL | grep  "HTTP/"
.
Step 1: kube-apiserver stores pods info in etcd
When a pod is created in the cluster, the kube-apiserver registers and stores the pod’s details (such as its IP address, metadata, and status) in the etcd key-value store.
To verify the communication between the kube-apiserver and etcd, you can inspect the API server logs. Here’s an example of how to check the logs to see if the cluster IP of the “sleep” pod is being stored:
API_SERVER=$(kubectl get pod -n kube-system -l component=kube-apiserver -o jsonpath={.items..metadata.name})
kubectl logs -n kube-system $API_SERVER -c kube-apiserver --tail=-1 --follow
I0923 17:55:18.597591 1 alloc.go:330] "allocated clusterIPs" service="application/sleep" clusterIPs={"IPv4":"10.110.159.190"}
Store cluster ip of sleep pod
Step 2: istiod retrieves the metadata from kube-apiserver
istiod retrieves the target pod’s metadata from kube-apiserver. pod ip, svc ip, ….
Step 3: The istio-proxy receives xDS
The istio-proxy in each pod receives dynamic configuration via the xDS APIs (Envoy’s discovery services), which are responsible for enabling service discovery and traffic management within the mesh. istiod sends updated service information (e.g., listeners, routes, clusters, and endpoints) to istio-proxy to ensure that it has the latest data about the services in the mesh.
To verify the behavior of istiod (Discovery Container), you can check its logs:
ISTIOD_POD=$(kubectl get pod -l app=istiod -n istio-system -o jsonpath={.items..metadata.name})
CONTAINER=$(kubectl get pods $ISTIOD_POD -n istio-system -o jsonpath='{.spec.containers[*].name}')
k logs $ISTIOD_POD -c $CONTAINER -n istio-system
# Here’s an example of the logs showing xDS discovery in action:
2024-09-25T22:23:12.459061Z     info    delta   CDS: PUSH request for node:dest-depl-v1-76d8b6b9c5-gqk88.application resources:26 removed:0 size:25.3kB cached:14/22
2024-09-25T22:23:12.467421Z     info    delta   EDS: PUSH request for node:dest-depl-v1-76d8b6b9c5-gqk88.application resources:22 removed:0 size:3.6kB empty:0 cached:14/22 filtered:0
2024-09-25T22:23:12.475645Z     info    delta   LDS: PUSH request for node:dest-depl-v1-76d8b6b9c5-gqk88.application resources:19 removed:0 size:76.9kB
2024-09-25T22:23:12.490859Z     info    delta   RDS: PUSH request for node:dest-depl-v1-76d8b6b9c5-gqk88.application resources:9 removed:0 size:7.9kB cached:7/9 filtered:0
Envoy discovers dynamic resources via xDS APIs (Discovery APIs). These APIs can operate over: gRPC streams
Step 4: Send Request to istio-proxy
The application in the source pod sends a request, which is intercepted by iptables and redirected to the istio-proxy in the same pod. Acting as a load balancer, istio-proxy processes the request and routes it to the target service based on the server-side discovery pattern.
Step 5: Forward Request to Target istio-proxy
The istio-proxy in the source pod forwards the request to the istio-proxy in the target pod, using xDS discovery to select the appropriate service instance and handle load balancing.
Step 6: Route Request to Target Application
Finally, the istio-proxy in the target pod routes the request to the target application container.
kubectl logs -c istio-proxy $TARGET_POD -n application | grep HTTP/1.1
[2024-09-25T22:24:12.210Z] "GET / HTTP/1.1" 200 - via_upstream - "-" 0 33 0 0 "-" "curl/8.10.1" "1a7d8ad2-7627-9b78-9c9b-7bd9fc77b34e" "dest-svc-v1.application.svc.cluster.local:7777" "10.244.0.115:5678" inbound|5678|| 127.0.0.6:55087 10.244.0.115:5678 10.244.0.107:40090 outbound_.7777_._.dest-svc-v1.application.svc.cluster.local default
🌐 Service Discovery with xDS

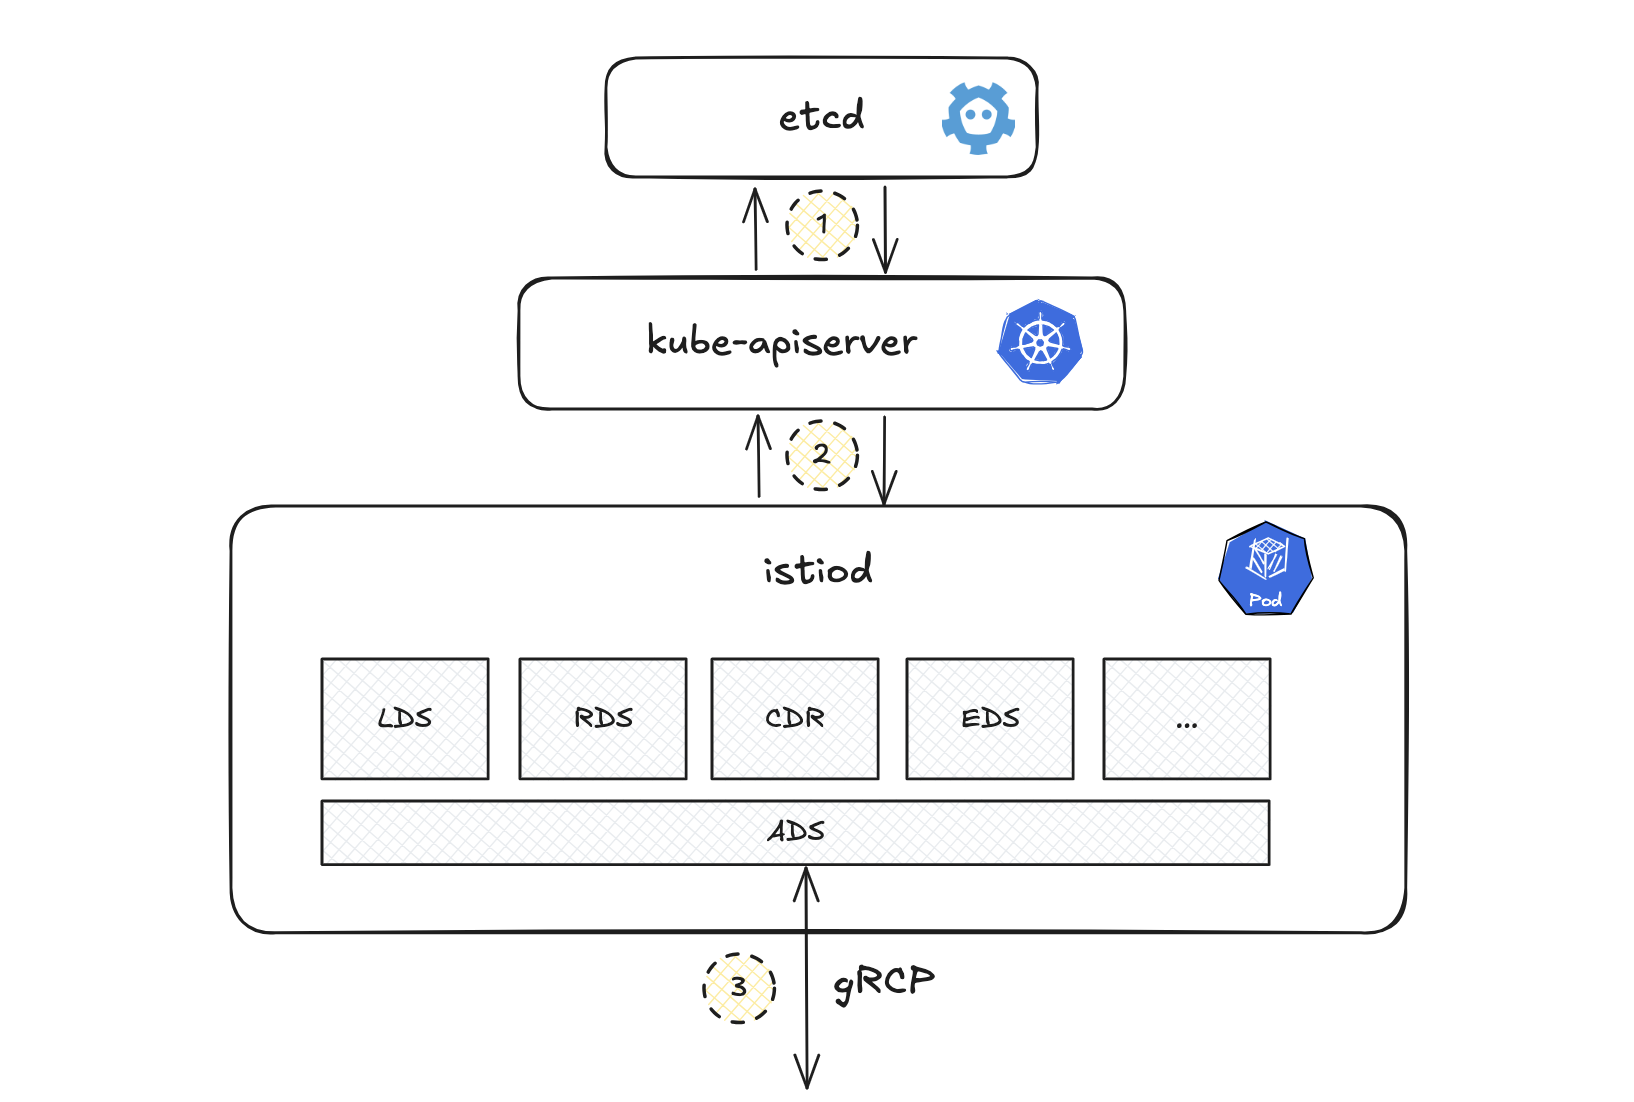
A gRPC bi-directional streaming connection is established between the xDS and the istio-proxy container, enabling the xDS to respond to requests and proactively push destination information.
While multiple xDS endpoints provide specific service data, querying them individually can result in version inconsistencies in Envoy. To mitigate this, Istio employs the Aggregated Discovery Service (ADS) API, which consolidates information from all xDS, ensuring consistent and synchronized updates.
- LDS: Listener DS
- RDS: Route DS
- CDS: Cluster DS
- EDS: Endpoint DS
- ADS: Aggregated DS
Later, you can explore each xDS API in more depth, following the process from LDS to EDS to understand how service configuration and traffic routing evolve in the service mesh.
Envoy API Overview
To explore the details of the ADS API and other xDS APIs, we will access the Envoy API on port 15000.
Check Envoy Status
To verify if Envoy is ready to serve traffic, run the following command:
URL="http://localhost:15000/config_dump"
Check if Envoy is ready to serve traffic:
# Returns a simple status page indicating whether Envoy is ready to serve traffic
URL="http://localhost:15000/ready"
kubectl exec -it $TARGET_POD -n application -c istio-proxy -- curl $URL
LIVE
Check server information:
URL="http://localhost:15000/server_info"
kubectl exec -it $TARGET_POD -n application -c istio-proxy -- curl $URL | grep WORKLOAD_NAME
kubectl exec -it $TARGET_POD -n application -c istio-proxy -- curl $URL | grep INSTANCE_IPS
"WORKLOAD_NAME": "dest-depl-v1",
"INSTANCE_IPS": "10.244.0.115",
Update Envoy Log Level You can dynamically adjust the log level of Envoy by executing:
URL="http://localhost:15000/logging?level=debug"
kubectl exec -it $TARGET_POD -n application -c istio-proxy -- curl -X POST $URL
active loggers:
  admin: debug
  alternate_protocols_cache: debug
  aws: debug
  assert: debug
  backtrace: debug
  basic_auth: debug
  cache_filter: debug
  client: debug
  config: debug
  connection: debug
  conn_handler: debug
  compression: debug
  credential_injector: debug
  decompression: debug
  dns: debug
  dubbo: debug
  envoy_bug: debug
  ext_authz: debug
  ext_proc: debug
  rocketmq: debug
  file: debug
  filter: debug
  forward_proxy: debug
  geolocation: debug
  grpc: debug
...
📦️ Understanding the Istio-Proxy Container
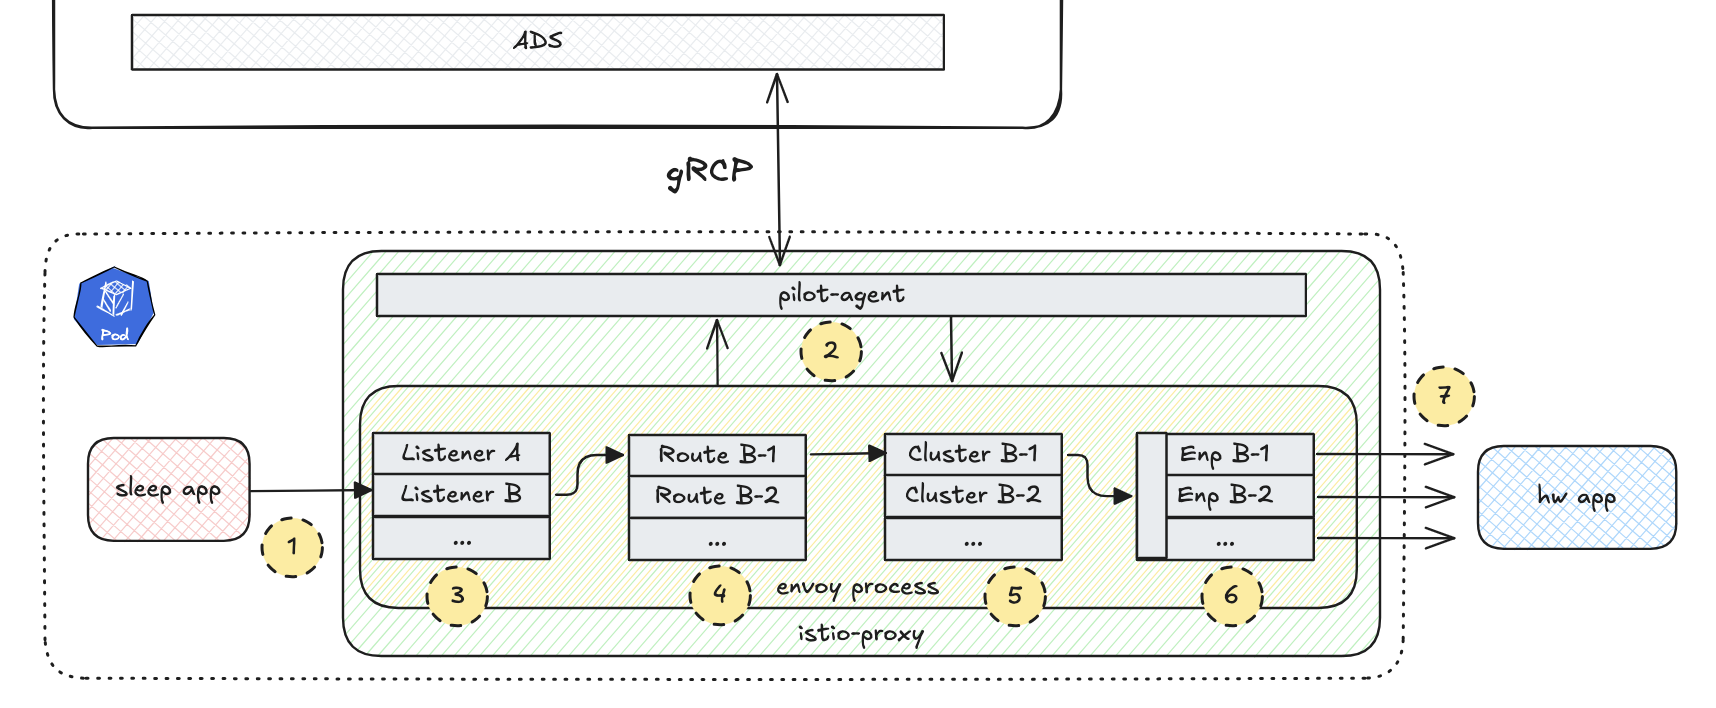
Let’s delve into the Istio-proxy container to observe the step-by-step process of xDS within the source pod.

How to work Envoy within istio-proxy?
1. Request Reception
Envoy receives a request from the source microservice.
2. ADS-API Call
Envoy retrieves destination container info from the ADS-API via pilot-agent in streaming gRPC.
URL="http://localhost:15000/config_dump"
kubectl exec -it $TARGET_POD -n application -c istio-proxy -- curl $URL | jq '.configs[0].bootstrap.node.metadata.NAME'
kubectl exec -it $TARGET_POD -n application -c istio-proxy -- curl $URL | jq '.configs[0].bootstrap.node.metadata.POD_PORTS'
dest-depl-v1-76d8b6b9c5-fp784

"[{\"containerPort\":7777,\"protocol\":\"TCP\"}]"
3. Listener Selection
Envoy selects the appropriate listener based on the incoming request.
URL="http://localhost:15000/config_dump?resource={dynamic_listeners}"
kubectl exec -it $TARGET_POD -n application -c istio-proxy -- curl $URL

URL="http://localhost:15000/listeners"
kubectl exec -it $TARGET_POD -n application -c istio-proxy -- curl $URL | grep 7777
0.0.0.0_7777::0.0.0.0:7777
You can also use istioctl proxy-config (istioctl pc) to check Envoy’s configuration (clusters, ecds, endpoints, listeners, routes, etc.).
istioctl pc listeners -n application $TARGET_POD | grep 7777
0.0.0.0  7777  Trans: raw_buffer; App: http/1.1,h2c     Route: 7777
0.0.0.0  7777  ALL                                      PassthroughCluster
4. Route Selection
Envoy determines the route to be taken for the request.
URL="http://localhost:15000/config_dump?resource={dynamic_route_configs}"
kubectl exec -it $TARGET_POD -n application -c istio-proxy -- curl $URL

istioctl pc route $TARGET_POD -n application | grep 7777
7777             dest-svc-error.application.svc.cluster.local:7777   dest-svc-error, dest-svc-error.application + 1 more...   /*
7777             dest-svc-v1.application.svc.cluster.local:7777      dest-svc-v1, dest-svc-v1.application + 1 more...         /*
7777             dest-svc-v2.application.svc.cluster.local:7777      dest-svc-v2, dest-svc-v2.application + 1 more...         /*
inbound|5678||   inbound|http|7777                                   *                                                        /*
inbound|5678||   inbound|http|7777                                   *                                                        /*
5. Cluster Selection
Envoy selects the appropriate cluster based on the route.
URL="http://localhost:15000/config_dump?resource={dynamic_active_clusters}"
kubectl exec -it $TARGET_POD -n application -c istio-proxy -- curl $URL

URL="http://localhost:15000/clusters"
kubectl exec -it $TARGET_POD -n application -c istio-proxy -- curl $URL  | grep eds_service_n:outbound777
outbound|7777||dest-svc-error.application.svc.cluster.local::eds_service_name::outbound|7777||dest-svc-error.application.svc.cluster.local
outbound|7777||dest-svc-v2.application.svc.cluster.local::eds_service_name::outbound|7777||dest-svc-v2.application.svc.cluster.local
outbound|7777||dest-svc-v1.application.svc.cluster.local::eds_service_name::outbound|7777||dest-svc-v1.application.svc.cluster.local
istioctl pc clusters -n application $TARGET_POD | grep 7777
dest-svc-error.application.svc.cluster.local    7777      -    outbound      EDS
dest-svc-v1.application.svc.cluster.local       7777      -    outbound      EDS
dest-svc-v2.application.svc.cluster.local       7777      -    outbound      EDS
6. Endpoint Selection
Envoy chooses a specific endpoint within the cluster to send the request.
URL="http://localhost:15000/config_dump?include_eds"
kubectl exec -it $TARGET_POD -n application -c istio-proxy -- curl $URL
istioctl pc endpoints $TARGET_POD -n application | grep 7777
10.244.0.115:5678 HEALTHY OK outbound|7777||dest-svc-v1.application.svc.cluster.local
7. Request Transmission
Envoy sends the request to the destination microservice.

This process illustrates the detailed traffic flow between microservices within Istio.
ℹ️ Summary
Through this detailed breakdown, we saw how Istio uses its powerful service discovery mechanisms to manage traffic efficiently within a service mesh. The combination of Envoy proxies and xDS ensures that services can scale dynamically while maintaining reliable communication between microservices.
Stay tuned for more insights on Istio’s architecture and its impact on modern application development!